
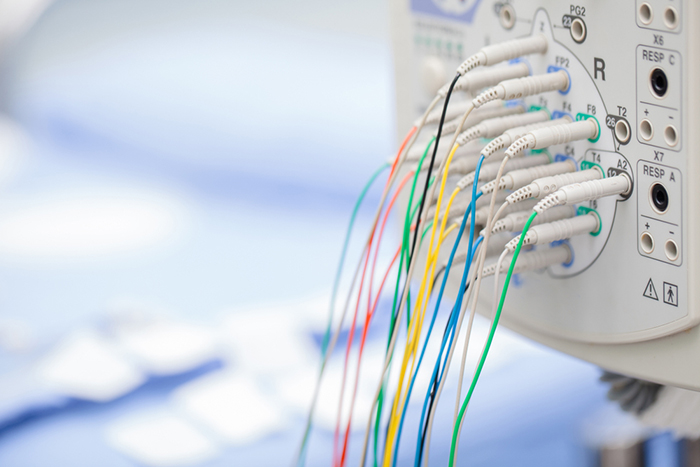
EEG/QEEG Instrumentation
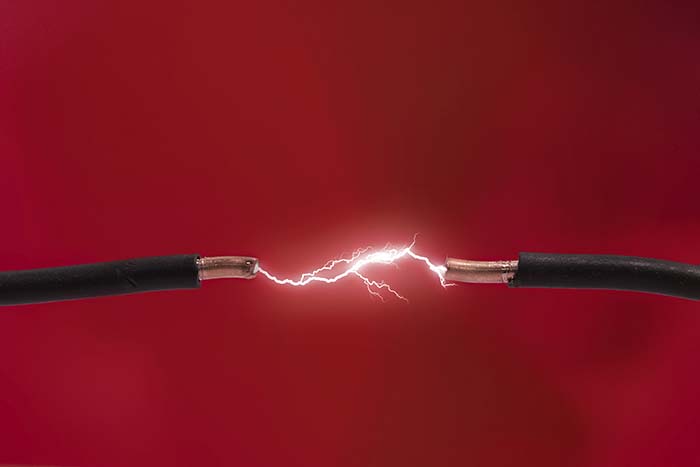
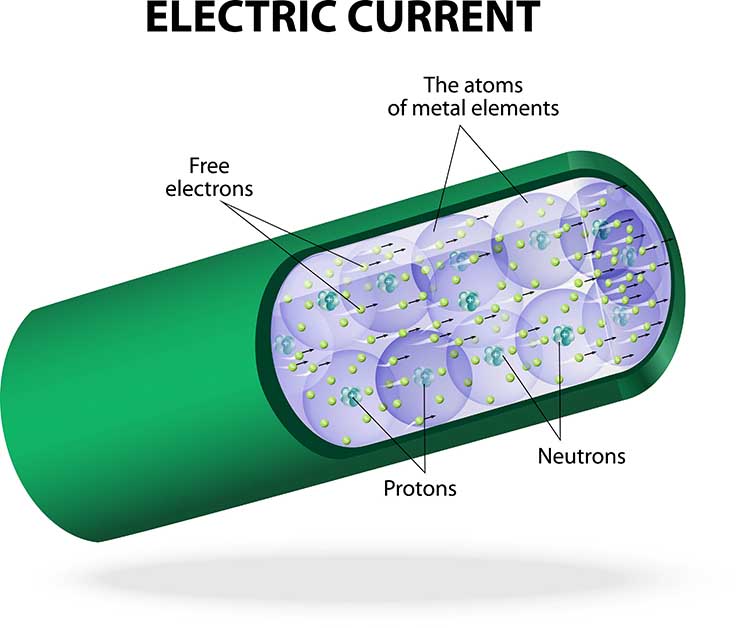
Electricity makes most biofeedback applications possible. Biological signals like skeletal muscle and cortical voltages are streams of charged atoms or molecules called ions. The hardware that monitors these signals is powered by batteries or wall outlets that supply currents of electrons. Graphic © Vladimir Popovic/iStockphoto.com.
Without a basic understanding of electricity and the circuits used in biofeedback instruments, we might mistakenly accept readings produced by equipment misuse or breakdown. "Garbage in, garbage out."
BCIA Blueprint Coverage
This unit addresses III. EEG/QEEG Neurofeedback Instrumentation (2 hours). This unit covers Essential Terms and Concepts, Signal Acquisition, Signal Processing, Aseptic Techniques, and Instrumentation Demonstration.
A. ESSENTIAL TERMS AND CONCEPTS

This section covers A. Essential Terms and Concepts, EEG Recording, and Safety Precautions.
Building Blocks of Matter
The matter comprising our universe occupies space and possesses mass. Matter can assume solid, liquid, gaseous, and plasma states. Graphic © magnetix/Shutterstock.com.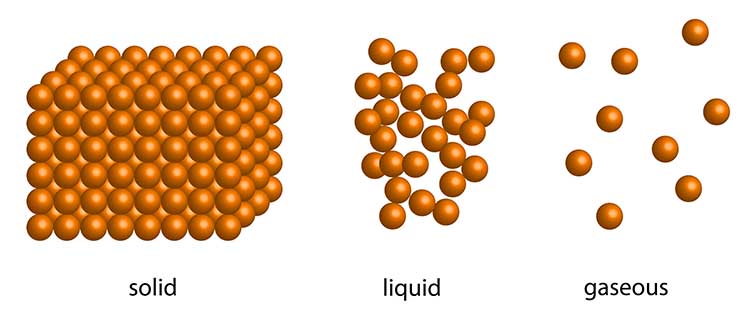
Atoms are basic units of matter consisting of a central nucleus that contains protons and neutrons and orbiting electrons.
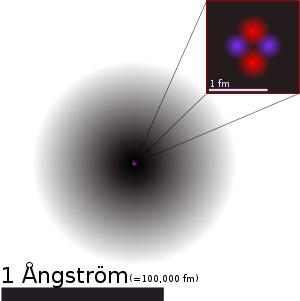
The positively charged nucleus contains most of an atom's mass in the form of positively charged protons and uncharged neutrons. Each proton carries a positive charge that is equal and opposite to the electron's negative charge. Negatively charged electrons rotate around the nucleus at varying distances and participate in chemical reactions. The number of electrons equals the number of protons in an atom, balancing the electrical charge of the nucleus. In other words, an atom’s net charge is zero, and an atom is said to be neutral. Graphic © Designua/Shutterstock.com depicts a carbon atom.
>

Elements are substances that contain identical atoms and cannot be reduced by common chemical reactions. Of the 118 elements confirmed to date, calcium (Ca), carbon (C), hydrogen (H), nitrogen (N), oxygen (O), and phosphorous (P) are most important to human life (Grant, 2015). Calcium (Ca), chloride (Cl), potassium (K), and sodium (Na) are critical to generating physiological potentials like the EEG. Elements are neutrally charged since their atoms contain an equal number of protons and electrons. Graphic © Designua/ Shutterstock.com.

How does a carbon atom differ from a sodium atom? The difference lies in the number of protons located in the nucleus. A carbon atom has 6 protons, while a sodium atom has 11. The total number of protons determines the atomic number. The number of protons and neutrons approximates the atomic weight.
Ions are atoms or molecules charged by the gain or loss of electrons. The biological potentials produced by cortical neurons (EEG), eccrine sweat glands (EDA), and skeletal muscles (SEMG) are currents of ions. The ions most responsible for these signals are chloride (Cl-), potassium (K+), and sodium (Na+).
Electric Current
Charge (Q) indicates the imbalance between positively and negatively charged particles in a given place or between two locations. Charge is measured in coulombs.
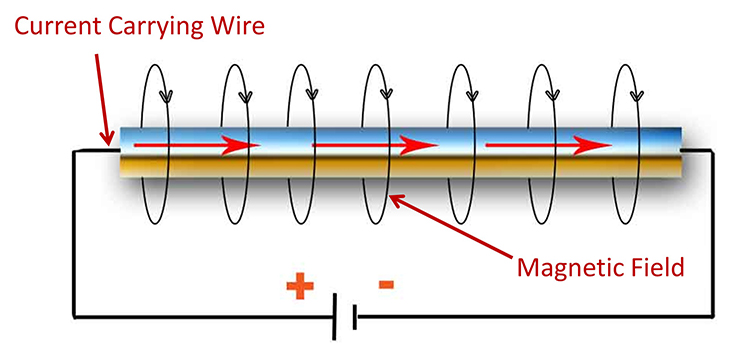
Current (I) is the movement of electrons through a conductor. Current flows because atoms and molecules contain two types of electrical charge: positive and negative. Opposite charges attract while identical charges repel each other. When there is a difference in the overall charge of atoms between two points—for example, between two ends of a wire—negatively charged electrons will flow toward the positively charged end of the wire, creating an electric current.
Listen to a mini-lecture on Current © BioSource Software LLC. Graphic © Designua/Shutterstock.com.
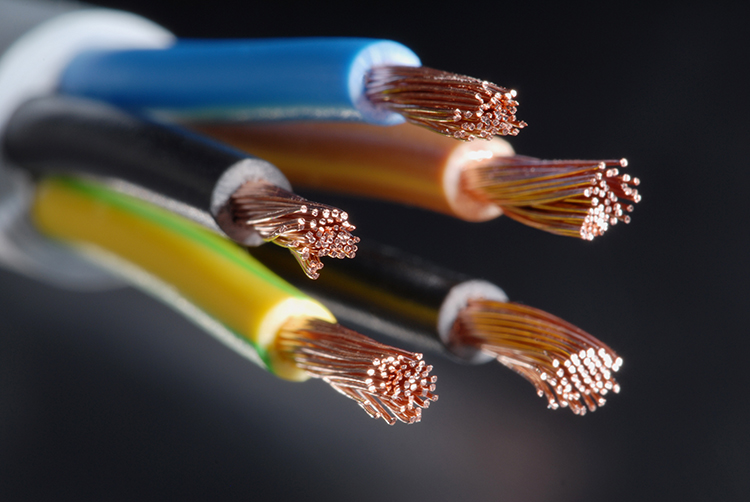
Electrons are also affected by the materials in their path. Conductors like copper allow electron movement, while the insulators enclosing the wires oppose their movement.
Listen to a mini-lecture on Conductors © BioSource Software LLC. Graphic © demarcomedia/Shutterstock.com.
Conductors and Insulators
Biological signals like the EEG travel through interstitial fluid,
which is the fluid between the cells in our bodies. Signals like the EEG bump their way
through body fluids as a current of colliding ions (not electrons) until they reach the skin. This process, called volume conduction, allows us to eavesdrop on the scalp's cortical potentials instead of inserting electrodes inside the brain. Electrodes are specialized conductors that convert biological signals like the EEG
into currents of electrons. Surface EEG electrodes function like an antenna to detect the EEG signals produced by
macrocolumns of cortical neurons. Currents of ions, atoms with positive or negative charges, volume conduct to the
scalp (like an FM radio broadcast), and electrodes convert this signal to a current of electrons (Stern et al., 2001). Graphic © Zyabich/Shutterstock.com.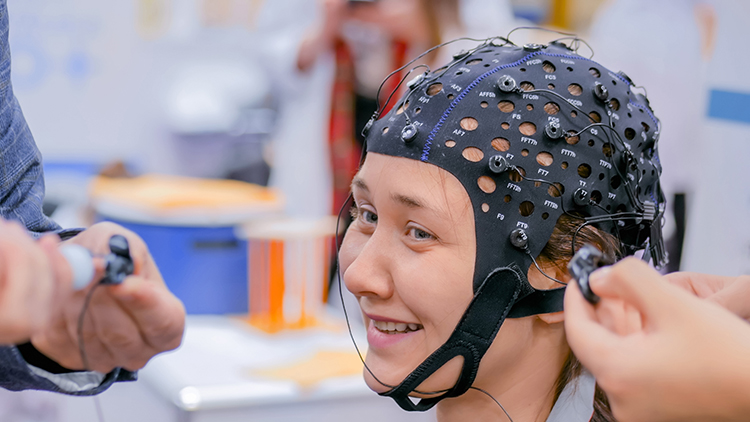
Insulation from body fat, connective tissue, and the epidermis (outer skin layer) interferes with ion current flow and can significantly reduce surface EMG readings. Like the rubber covering the wiring of a muscle electrode, insulators block the flow of electric currents. In natural and fabricated insulators, a large number of electrons in their final energy level produces a cohesiveness that resists electron loss due to collision. The best insulators, like rubber, possess the maximum number of outer-level electrons (Nilsson & Riedel, 2008).
Measuring Current
When we measure current, we learn how much "x" has passed by a point over a fixed period. The "amount" of electric current is measured in amperes (A). You have used 1 ampere of current when 1 coulomb (6.24 x 10¹⁸ or 6 billion billion electrons) has passed a point in 1 second (Kubala, 2009).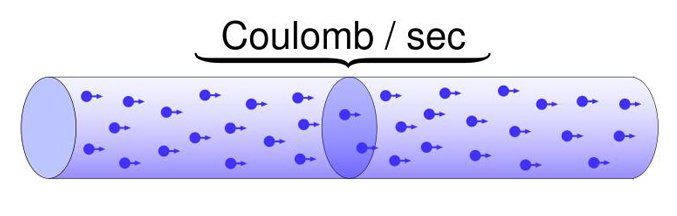
DC and AC
Electricity travels as either a direct current (DC) or alternating current (AC). Direct current (DC) is the flow of electricity in one direction—from negative to positive. A difference in electrical potential pressures electrons to move. The negative end of a wire repels electrons (e-) while the positive end attracts them. Biological signals representing peripheral blood flow (blood volume pulse and skin temperature), respiration, and skin electrical activity are all DC signals.When we plot DC signals against time, they never completely reverse direction over a second. The electroencephalogram (EEG) contains both DC (slow cortical potentials) and AC (slow cortical potentials and delta through 40-Hz) waveforms. BioGraph ® Infiniti blood volume pulse (BVP) display.
In the space of a second, an alternating current (AC) regularly reverses direction 50 or 60 times. The frequency of an alternating current is the number of cycles completed per second or hertz (Hz). Electrical potentials detected from the cerebral cortex (EEG), heart (ECG), and skeletal muscles (SEMG) all contain AC waveforms (Kubala, 2009). Check out the YouTube video AC and DC Differences.
BioGraph ® Infiniti 60-Hz artifact display. The software uses an auto-scale feature to keep the fluctuating signal on the screen.
The movie below is a single channel BioTrace+ /NeXus-32 display of EEG activity from 1-64 Hz activity broken into component delta, theta, alpha, and beta frequency bands by digital filters © John S. Anderson.
Electromotive Force (EMF)
What forces electrons to move through a circuit? Electrons flow when there is a difference in electrical potential or charge. A flashlight works because its battery contains negative and positive poles. These two regions of opposite charge produce an electrical potential difference called the electromotive force (EMF) that drives the current ahead. The electrical potential difference can be considered the "strength" of the current. A battery's negative pole repels electrons (e-) while its positive pole attracts them, resulting in current flow. If the battery's two poles had identical charges, instead, electrons would stay put. No potential difference, no current, and no light (Nilsson & Riedel, 2008).Note the negative and positive poles of the circuit that cause the current to move through the wire below.
Voltage
The pressure a battery exerts on electrons flowing through a flashlight is measured in volts (E). A typical flashlight battery is rated at 1.5 volts. One volt is the potential difference required to make 1 coulomb (6.24 x 10¹⁸ electrons) perform 1 joule of work. Voltage indexes signal power (Nilsson & Riedel, 2008).When monitoring biological signals, you will record signals ranging from microvolts or μV (millionths of a volt) to millivolts or mV (thousandths of a volt). EEG and SEMG amplitudes are measured in microvolts (μV) and are usually less than 100 μV.
In neurofeedback, clinicians and researchers increasingly express the quantitative EEG (qEEG) signal strength, digitized statistical brain mapping using at least a 19-channel montage to measure EEG amplitude within specific frequency bins, in picowatts (trillionths of a watt).
Watts
An electric current’s overall power depends on the amount of current flowing through a circuit (measured in amperes) and the electric potential driving it (measured in volts). Electric power is measured in watts (W). One watt is equal to one ampere moving at one volt. Multiplying amperes by volts produces the number of watts. For example, an appliance that uses 10 amperes and runs on 115 volts consumes 1150 watts of power (Kubala, 2009). Below are 21- and 32-channel Mitsar amplifier systems featured on the NovaTech EEG website.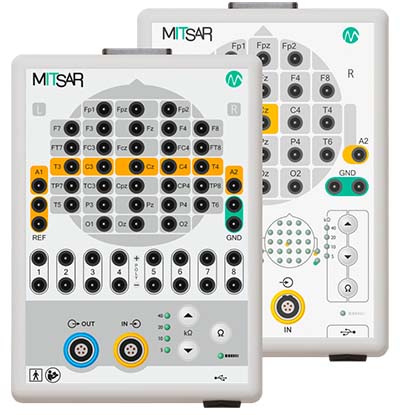
Resistance
The electrons moving through a conductor encounter opposition which reduces current flow. This phenomenon is called resistance (R) in DC circuits and impedance (Z) in AC circuits and is measured in ohms (Ω). Resistance depends on the number of electrons found in an atom's outermost energy level.Listen to a mini-lecture on Resistance and Conductance © BioSource Software LLC. Graphic © Peter Hermes Furian/Shutterstock.com. Electrons are red, protons are green, and neutrons are gray.

Increasing the numbers of electrons in this level binds these electrons more tightly together. This cohesiveness reduces the loss of electrons due to collisions with free electrons. The graphic below © Signals.com.

Resistance is a practical concern in biofeedback. Biological signals compete with stronger false signals for a biofeedback instrument's attention. Clinicians clean, abrade and apply conductive gel to their clients' skin when monitoring the brain (EEG) and skeletal muscles (SEMG). Since dead skin, oil, and dirt block biological potentials from reaching electrodes, these precautions improve signal reception.

Dry electrodes like BrainMaster's Freedom 20R do not require time-consuming skin preparation and the application of conductive paste.
Skin resistance is also a biological signal, in its own right, that reflects emotional and cognitive processes. Clinicians measure skin resistance level (SRL) by running an AC or DC across the inner surface of the fingers or palm. SRL is expressed in Kohms of resistance per cm2. Typical values range from 0-500 Kohms/cm2. Lower values reflect more intense sweat gland activity since moisture reduces resistance.
Conductance
Resistance and conductance are mirror images of each other. Resistance is the reciprocal of conductance. Where resistance measures the opposition free electrons encounter, conductance (G) indexes how easily they travel through a conductor like copper or silver. The grraphic depicts resistors in a computer circuit © Kovakchuk Oleksandr/Shutterstock.com.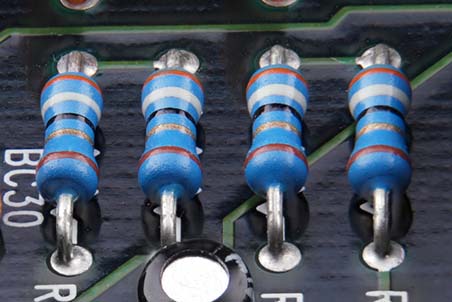
Resistance is expressed in ohms (Ω). Conductance is now measured in Siemens and was previously measured in mhos (mho is ohm spelled backwards). Skin conductance is one index of eccrine sweat gland activity.
Ohm's Law
Ohm’s law states that the “amount” of current (I) flowing through a conductor is equal to the voltage (E) (the “push”) divided by the resistance (R). These values are measured in amperes, volts, and ohms, respectively (Nilsson & Riedel, 2008).Ohm’s law can be used to find any value in a DC circuit: Voltage (E) = current (I) x resistance (R). Graphic © Emre Terim/Shutterstock.com.
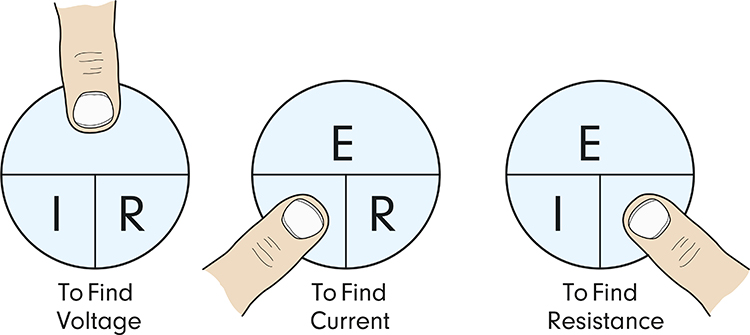
For example, using actual units, 10 volts = 2 amperes x 5 ohms. Check out the YouTube video MAKE Presents: Ohms Law.
Ohm's law is helpful because it describes the relationship between voltage, current, and resistance. We can use this law to show two ways used to detect adequate voltages.
First, if voltage (E) = current (I) x resistance (R), then we can increase the voltage by increasing current or resistance. Hardware designers use this relationship to increase the voltage reaching an electroencephalograph. When EEG voltages (current) enter an electroencephalograph's amplifier, they are dropped across a network of resistors (resistance). This large differential input impedance increases the EEG voltage seen by an electroencephalograph, which helps separate EEG voltages from artifacts.
Second, we can restate Ohm's law from the standpoint of current. If current (I) = voltage (E) / resistance (R), then we can increase current by increasing voltage or reducing resistance. This relationship is the reason clinicians prepare the skin when monitoring the EEG. Skin abrasion and application of conductive gel/paste minimize resistance. This increases the current reaching EEG electrodes, which helps an electroencephalograph distinguish EEG activity from artifacts.
Impedance
In AC circuits, current periodically reverses direction. This introduces frequency, the number of cycles completed each second. Frequency is measured in hertz (Hz). When an AC travels through a circuit at a given frequency, it encounters a complex form of opposition called impedance (Z), measured in ohms (Ω). Impedance reduces current flow between electrodes and the brain surface.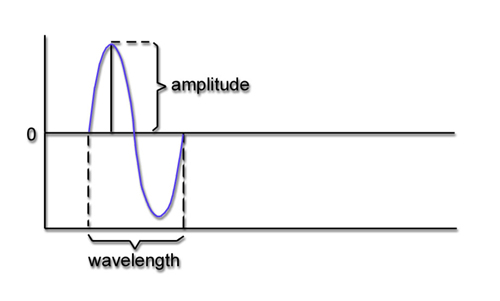
Clinicians perform an impedance test to determine whether they have correctly cleaned and abraded the skin and applied electrodes with sufficient gel or paste (Andreassi, 2007). Excessive impedance means that a weak biological signal must compete at a disadvantage with false electrical signals like power line artifacts. This could contaminate the EEG signal so severely that the electroencephalograph displays power line fluctuations instead of cortical activity.
We measure skin-electrode impedance by passing an AC through pairs of electrodes. An impedance test can be manually performed with a separate impedance meter (AC). Graphic from the bio-medical.com website.
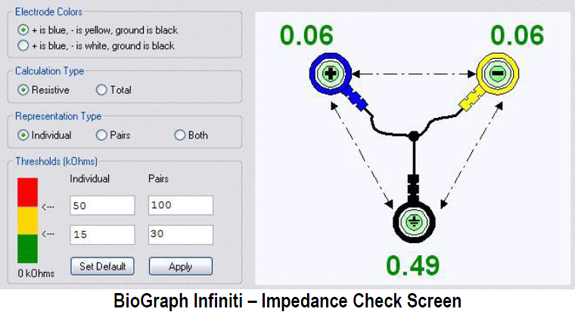
An impedance test may also be performed by software integrated with a data acquisition system and sensors.
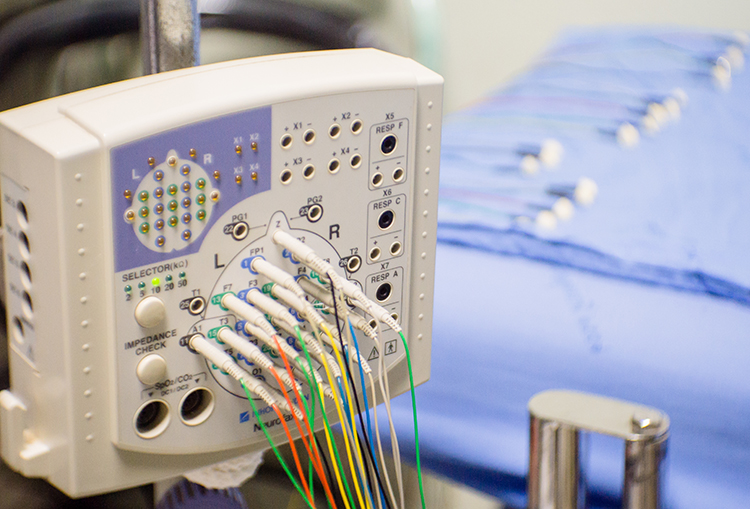
After the practitioner has positioned all electrodes, they should check their impedances or offsets using methods appropriate for their equipment. Electrodes that show excessive values can be reapplied after removing them to prepare the electrode site again, if necessary.
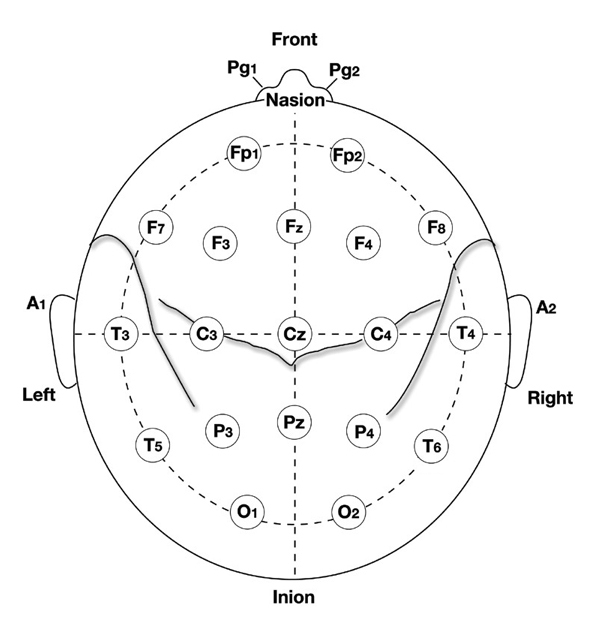
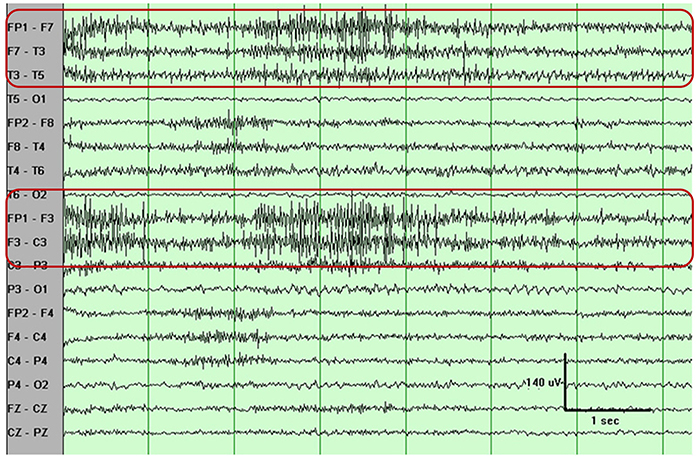
Unless skin-electrode impedance is low (under 5 KΩ for research and 20 KΩ for training) and balanced (under 1-3 KΩ ), diverse artifacts like 50/60 Hz and movement can contaminate the EEG signal, as seen in the P3 and Pz electrodes. Graphic © eegatlas-online.com.
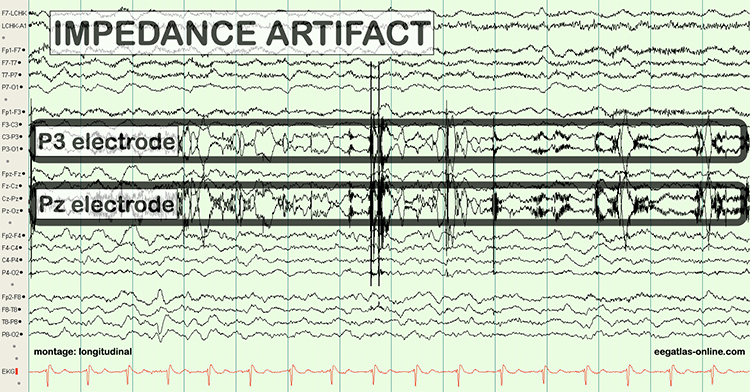
When the skin-electrode impedance at two sites is unequal, the resulting signals will appear to have different amplitudes when they reach the amplifier, regardless of the actual values. Unbalanced impedance will also increase DC offset values due to the battery effect. The amplifier will boost the resulting inaccurate input, which will be displayed to your client.
When a clinician fails to ensure low and balanced impedances at the start or during a training session, feedback regarding signal amplitude within specific frequency bands will be inaccurate. The wrong thresholds may be selected.
Michael and Lynda Thompson provided an example of an impedance problem that developed during a session because a hyperactive child scratched his ears, resulting in high and imbalanced impedances. Following corrective action that restored acceptable impedance values, high-beta activity (24-32 Hz) declined from 10-15 to 4 μV, gamma activity (45-58 Hz) declined below 2 μV, and SMR and beta activity returned to previous session values (Thompson & Thompson, 2015, p. 66).
DC Offset
DC offset is a voltage that results from combinations of factors, including electrode and gel/paste materials, interactions with skin, environment (humidity and temperature), and sweat gland activity due to stress level. The DC offset value should be consistent across all sensors and less than 25,000 μV, ideally below 10,000 μV. DC offset graphic © John S. Anderson.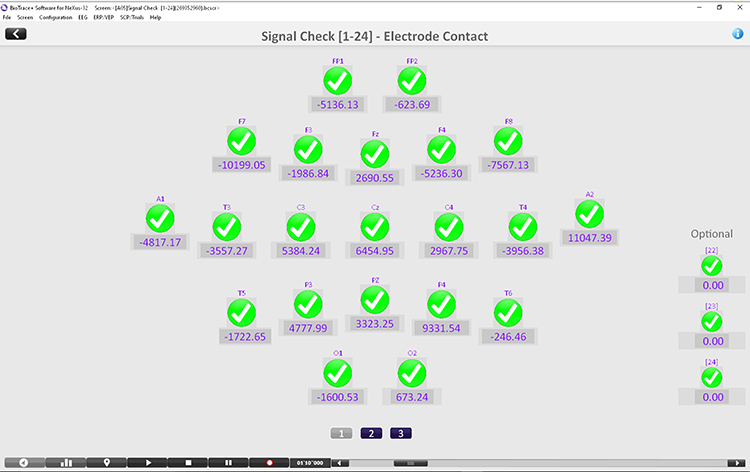
Ohm's Law for AC Circuits
We can extend Ohm's law to AC circuits by substituting impedance (z) for resistance and using lower case letters for voltage and current. The revised expression is voltage = current x impedance (e = i x z). This means that voltage is the product of a current flowing across an impedance. In actual units, 50 volts = 10 amperes x 5 ohms.Open and Closed Circuits
Broken electrode cables are a significant cause of equipment malfunction since they prevent electron movement. Clinicians perform a continuity test to check if a cable is damaged. An impedance meter sends an AC signal down the cable to measure opposition to current flow. If there is a break, there is no continuity, and the circuit is described as open. Impedance will be infinite since current cannot flow across space.A blown fuse illustrates an open circuit.
A filament in a fuse melts to create an open circuit when the current exceeds safe values. Graphic © AlexLMX/Shutterstock.com.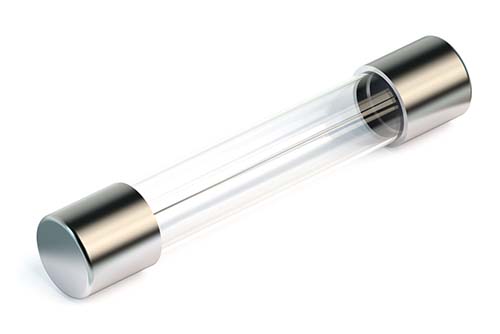
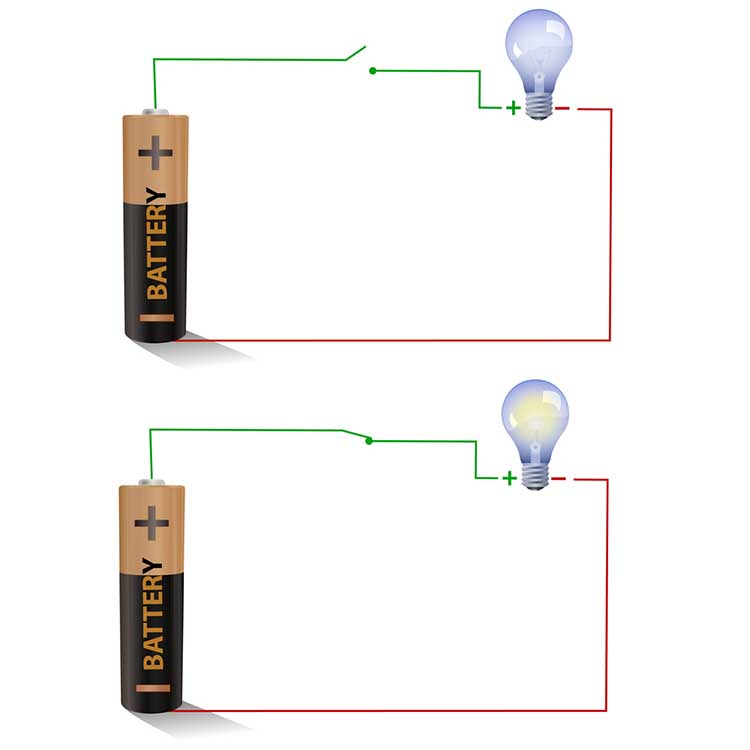
If the cable is free of breaks (continuous), the circuit is described as closed instead. Impedance will approach 0 Kohms since the current can easily travel through the circuit. Graphic © imagedb.com/ Shutterstock.com. The top diagram depicts an open circuit (light bulb off), while the bottom diagram shows a closed circuit (light bulb on).
Behavioral tests, also called tracking tests, check whether the circuit is closed and evaluate the performance of the entire data acquisition system.
For example, when monitoring EEG activity, a clinician can test the performance of the entire signal chain (EEG sensor, differential amplifier, gain amplifier, cable, encoder, and computer) by asking a client to close and then open the eyes. If the computer display mirrors these actions, the behavioral test has been passed, confirming no breaks in the cable.Short Circuit
A short circuit results when an unintended connection is made between two points of a circuit. Graphic © Designua/Shutterstock.com.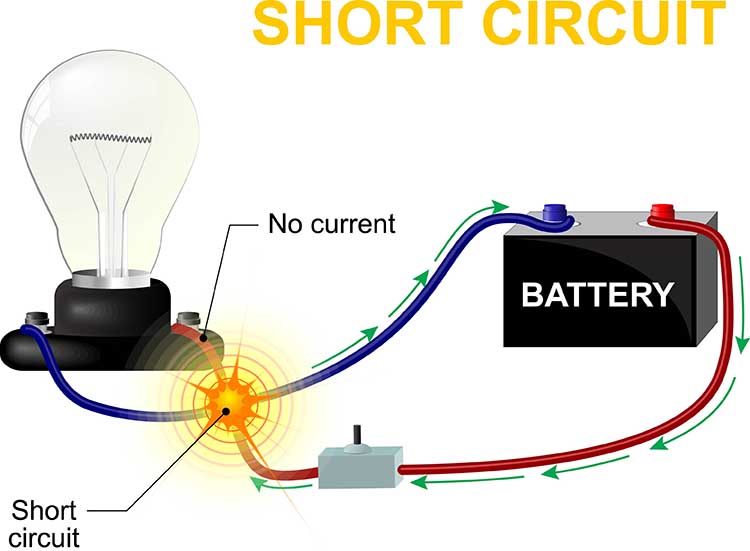
The new path has lower resistance than the original circuit and should measure close to 0 Kohms on an impedance meter. The reduced resistance draws electrons through the short and may increase current flow to levels that can melt circuitry and injure clients (Nilsson & Riedel, 2008).
Visualize a bare wire inside an electroencephalograph touching its metal case. The AC powering this equipment could leak through the metal case and injure anyone touching this surface.
Preventing Signal Contamination
Physiological signals are pretty small compared to surrounding electromagnetic “noise.” They need to be amplified to be distinguishable from background noise.Physiological monitoring requires high-quality connections between the subject and the electronic device. The quality of that connection determines the quality of the signal (information) gathered from that connection. Connections that are of poor quality, for whatever reason, produce poor quality (contaminated) information.
Many factors affect connection quality. These connection points include the skin surface, conductive gel or paste, sensors, and connecting wires.
EEG Recording
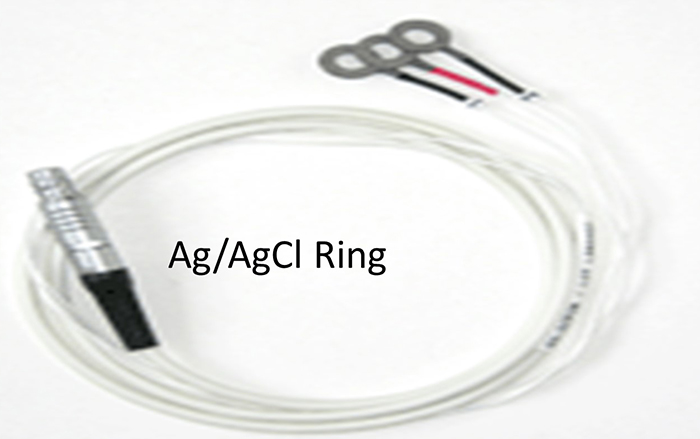
Electrodes
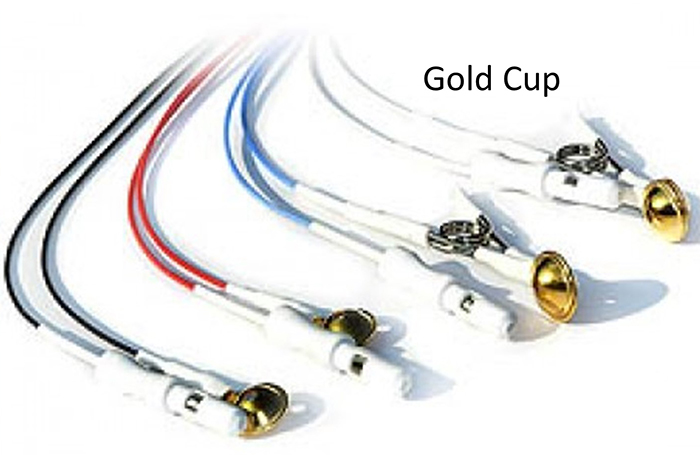
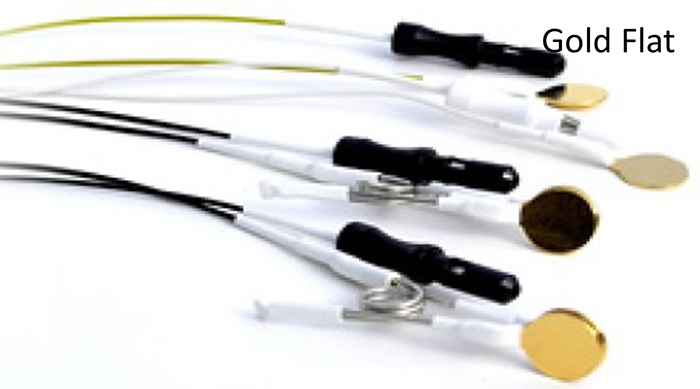
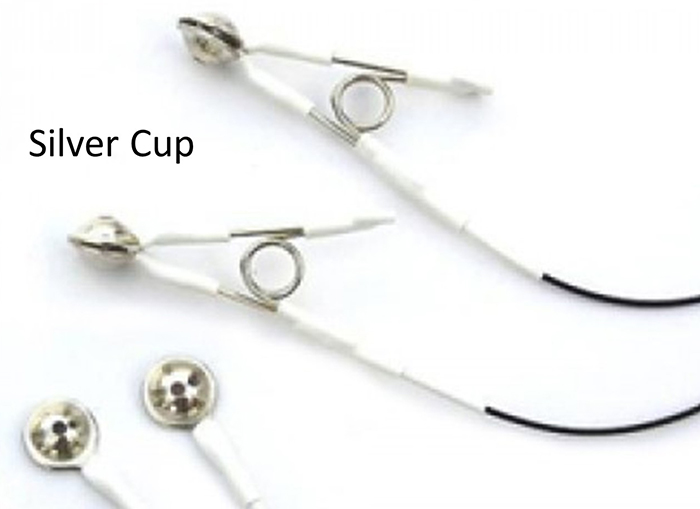
Electrodes detect biological signals. They are also
transducers since
they convert energy from one form to another. Four types of EEG electrodes are shown below: gold cup, gold flat, silver cup, and silver/silver-chloride ring.
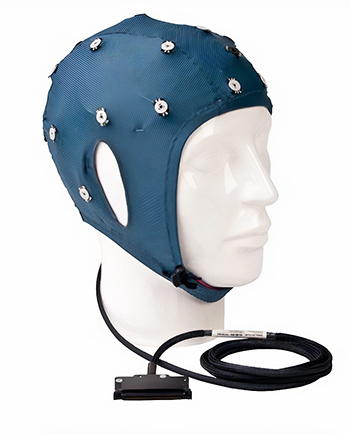
Cap systems like the pictured EEG cap share a connector containing a pin or other type of connector for each electrode. These connectors plug all electrodes into the amplifier at the same time.
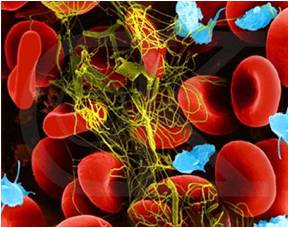
Consider how EEG electrodes work. In response to chemical and electrical synaptic messages, the dendrites of cortical pyramidal neurons develop excitatory postsynaptic potential (EPSPs) and inhibitory postsynaptic potentials (IPSPs) that travel about 10-12 centimeters as a current of ions through the cortex, blood vessels, glial cells, interstitial fluid, meninges, and skull to electrodes located on the scalp. This
process is called volume conduction. The photomicrograph below shows the interstitial fluid surrounding tissue through which graded potentials propagate.
Electrodes transform this current of
ions into a current of electrons that flows through the cable into an
electroencephalograph’s input jack.
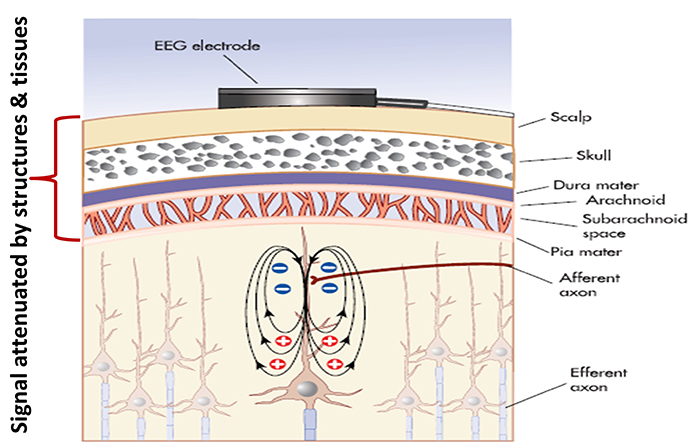
The EEG signal is attenuated during volume conduction. The volume-conducted signal that
reaches EEG electrodes is measured in
microvolts or millionths of a volt.
How do EEG electrodes work? When an EEG electrode is filled with a conductive gel or paste, the electrode metal donates ions to the electrolyte. In
turn, the electrolyte contributes ions to the metal surface. Electrodes create a DC voltage between the electrode metal and the electroconductive gel or paste. Signal
conduction succeeds as long as electrode and electrolyte ions are freely
exchanged.
Recording Problems
Conduction breaks down during polarization when chemical reactions produce separate regions of positive and negative charge where the electrode and gel make contact. DC flows across the connection between an electrode and the scalp. The current carries positive ions to the more negative region of this junction and negative ions to the more positive region. This build-up of ions polarizes the electrode to favor current flow in one direction and resists flow in the other.When an electrode is polarized, ion exchange is reduced, and impedance increases, weakening the signal reaching the electroencephalograph. This problem can result from routine clinical use. Electrode manufacturers control this problem by using silver/silver-chloride or gold electrodes that resist polarization.
Bias potentials are a second potential recording problem. They result from the exchange of metal ions donated by the electrodes and electrolytes in the absence of a biological current. Bias potentials can be prevented by using electrodes with intact surfaces and identical materials (e.g., all gold or silver).
Recording the EEG with Three Leads
We record scalp electrical activity using three recording electrodes: active, reference, and ground. We place the active electrode over a scalp site that is an EEG voltage source. We can locate the reference electrode over the scalp or neutral, but not electrically inactive, sites like an earlobe or the mastoid bone. Finally, we can place the ground electrode on an earlobe, mastoid bone, or the scalp (Demos, 2019). The ground electrode is grounded to the amplifier.Active and reference sensors are identical in construction and are each balanced inputs. They are interchangeable! However, some technologies require that you designate a sensor as a reference. For example, linked ears reference.
In the graphic below, the active (+) is red, the reference (-) is black, and the ground electrode (Gnd/Ref) is white.
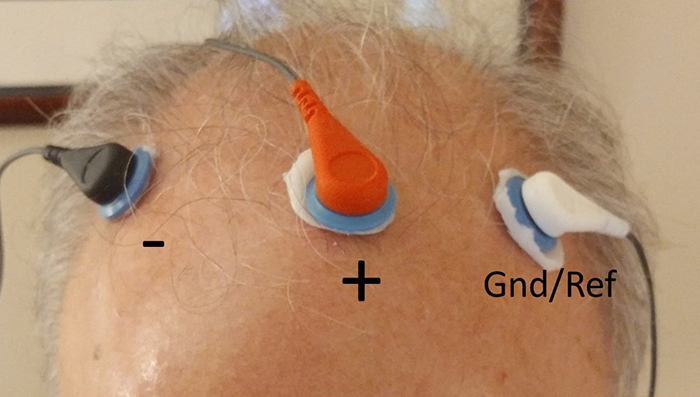
The voltages of the active and reference inputs are based on the ground.
EEG Apparatus
An electroencephalograph consists of the following stages: differential amplifier, gain amplifier, analog-to-digital converter, digital and FFT filters, and optical isolator.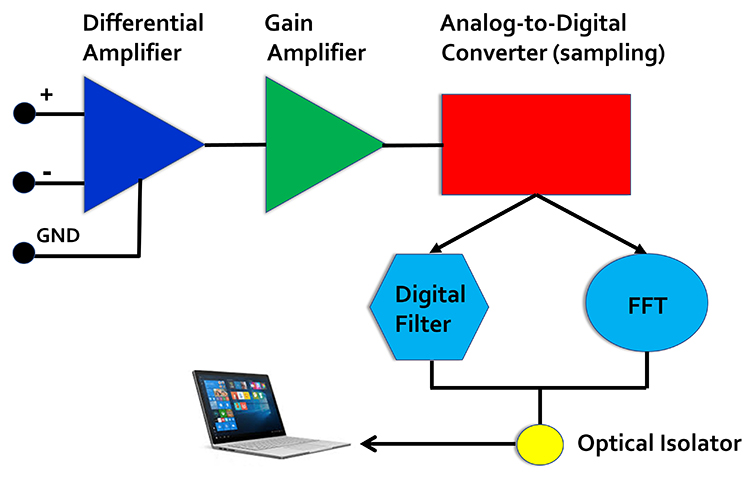
Signal Amplification
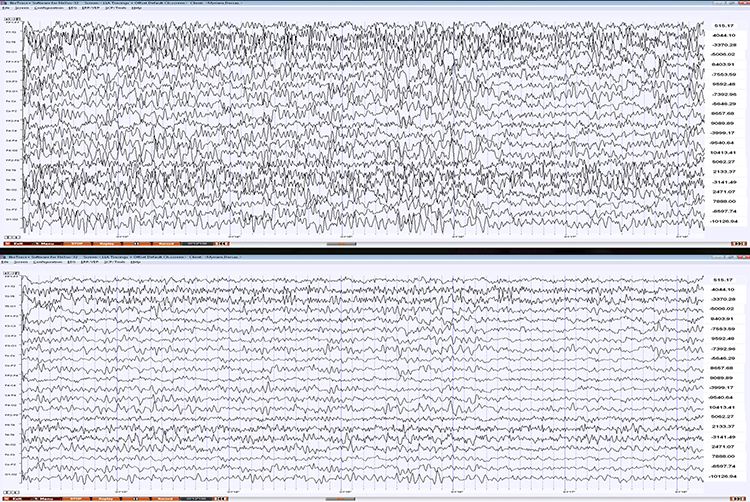
The biological signals monitored in biofeedback are very weak. The EEG signal, for example, is measured in microvolts (millionths of a volt). These signals must first be amplified over several stages to isolate the signal we are interested in and then drive displays. Stereo amplifiers perform the same tasks when they boost audio signals above the noise floor to levels that can power loudspeakers.Amplifiers share the properties of input sensitivity and gain. Input sensitivity is the maximum voltage level an amplifier can accept without producing clipping and distortion. The graphic below shows the same EEG signal with different sensitivity. The top tracing shows greater sensitivity than the bottom tracing, as evidenced by its substantially greater voltage swings.
Gain is an amplifier's ability to increase the magnitude of an input signal to create a higher output voltage. Gain is the ratio of output/input and is different for AC and DC systems. An amplifier that produces a 1-mV output from a 1-μV input has a gain of 1,000.
Differential Amplifiers
The EEG signal is first boosted by a differential amplifier and then by a gain amplifier. A differential amplifier, also called a balanced amplifier, amplifies the difference between the two inputs: the active (input 1) and reference (input 2). In the diagram below, the triangle represents the amplifier and the black circle the output voltage. Graphic © Hand Robot/Shutterstock.com.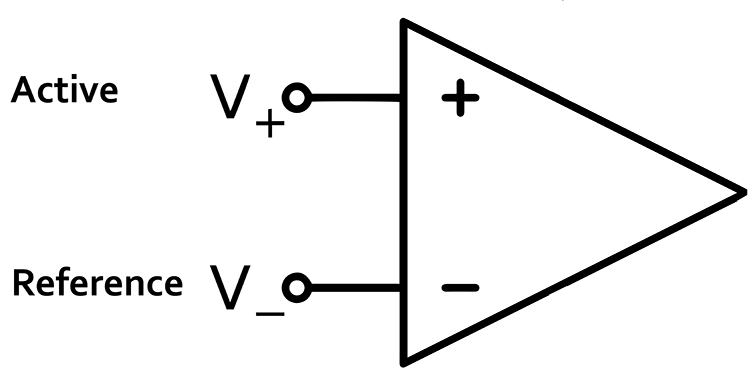
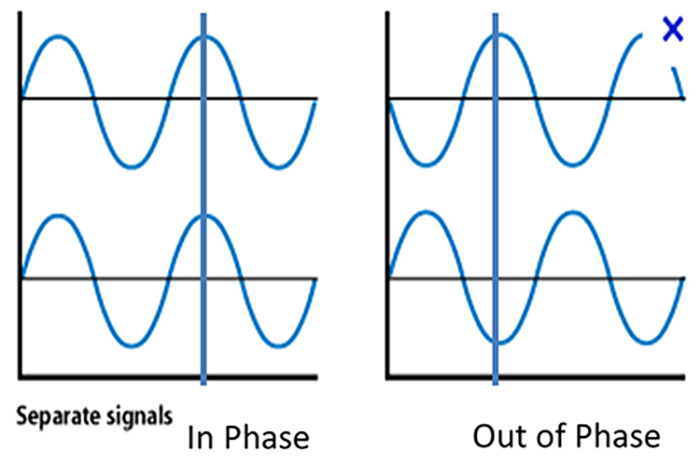
A differential amplifier combines two (or more) identical single-ended amplifiers with balanced inputs. The inputs are referenced to a common ground so that the resulting signals can be compared. The amplifiers are 180o out of phase so that signals that differ in frequency, amplitude, and phase are amplified. Only signal components that differ between two inputs are retained and amplified as output. Signals that are out of phase or possess different amplitudes are "seen" by the common-mode rejection process as different and are retained.
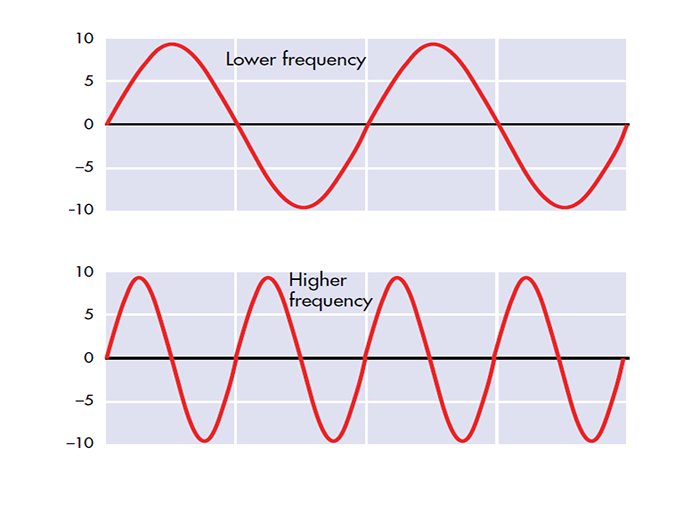
Frequency is the number of cycles per second (Hz).
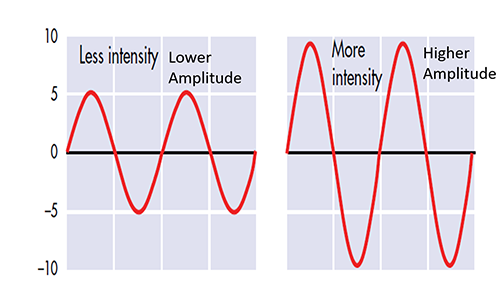
Amplitude is the signal voltage or power and is measured in microvolts or picowatts.
Phase is the similarity in timing of the waves at two locations. Note in the plot on the right. The two signals are 180o out of phase so that the top signal peaks when the bottom signal reaches its trough.
In the recording below, note the red-circled similar signals from the Fp1-LE and Fp1-O2 leads and the O2-LE and Fp1-O2 leads that should be subtracted by common-mode rejection. LE stands for the linked ear. LE-LE shows no voltage due to the complete subtraction of identical voltages from the exact anatomical location.
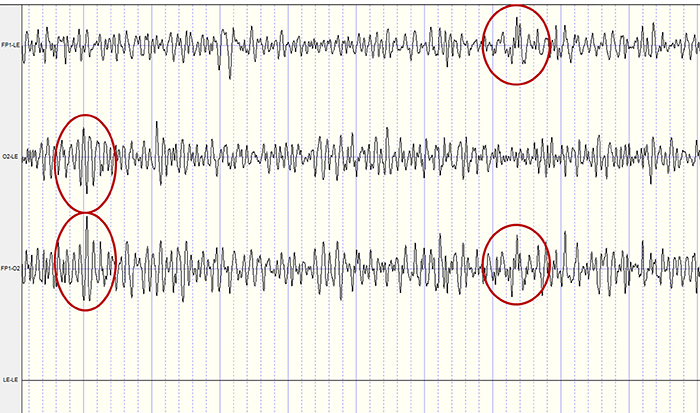
How does this reduce artifact? When there is no EEG activity, identical noise signals reach each amplifier. The differential amplifier subtracts these signals, canceling out the artifact. The output of a perfect differential amplifier would be 0.
The Challenges of Recording Infra-Slow EEG Activity
An AC amplifier has severe limitations when recording infra-slow (0-1 Hz) EEG activity. AC amplifiers exacerbate artifact effects. Client movement, eye movement, sweat, and transient field artifacts produce significant voltage changes. Long time constants over 80 s are recommended to integrate artifact-induced voltages over 2-4-min periods. However, persistent artifacts like eye movement will consistently degrade the signal-to-noise ratio of client feedback.Infra-slow recording requires DC-coupled amplifiers with a large dynamic range produced by 24-bit A/D converters to prevent saturation by slow drifts in baseline voltage. Standard EEG electrodes made of gold, steel, or tin are unacceptable because they suffer capacitance or energy storage, blocking lower frequencies. Silver/silver-chloride electrodes are ideal because they are reversible and do not polarize.
The clinician must distinguish slow artifacts from infra-slow signals. Eccrine sweat glands produce standing millivolt-range potentials. While these can be eliminated by partial skin puncturing, this practice risks infection transmission. Clinicians can identify eye blink and eye movement artifacts by their characteristic location. Body tilt, cough and strain, hyperventilation, and tongue movements produce high amplitude diffuse very slow potentials (Miller et al., 2007).
Common-Mode Rejection
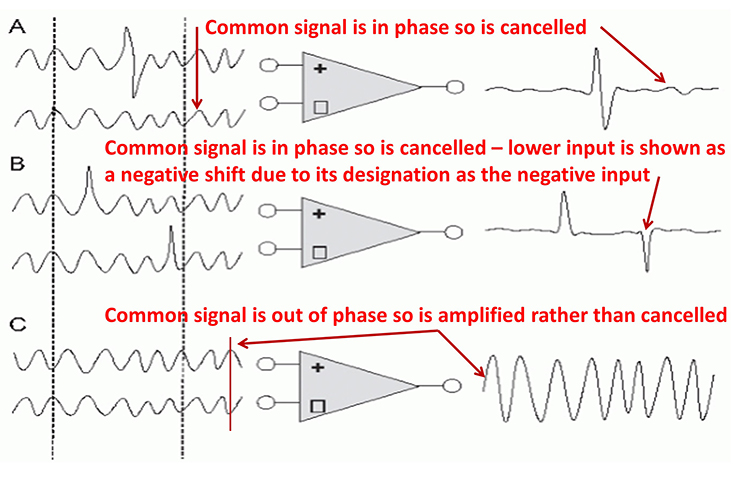
A differential amplifier’s separation of signal from artifacts is measured by the common-mode rejection ratio (CMRR). Since these amplifiers cancel out noise imperfectly, signal and noise will be boosted. The CMRR specification compares the degree by which a differential amplifier boosts signal (differential gain) and artifact (common-mode gain). CMRR = differential gain/common-mode gain.CMRR should be measured at 50/60Hz where the strongest artifacts, like power line (50/60Hz) noise, are found. The smallest acceptable ratio is 100 dB (100,000:1), which means that signal is boosted 100,000 times more than competing noise. State-of-the-art equipment exceeds a 180-dB ratio. Lower ratios could result in unacceptable contamination of biological signals.
The graphic shows common-mode rejection when the common signal is in phase and out of phase.
You can take nine steps to maximize common-mode rejection:
(1) ensure that skin-electrode impedances are balanced within 1-3 Kohm. If both actives receive identical noise signals, the imbalance will make the signals look different and prevent complete subtraction of noise.
(2) active electrodes should be equidistant from the artifact source.
(3) active, reference, and ground sensors should be the same distance from each other.
(4) when using two or more channels, the ground and each active should be the same distance apart.
(5) ensure that there is a good ground connection. A deficient ground connection can make different voltages appear identical, defeating common-mode rejection.
(6) identify artifact sources. You can use a portable electroencephalograph or electromyograph like a Geiger counter. Move the unit around the room with EEG sensors connected but held in your hand. Artifact sources should produce the largest display values.
(7) remove the artifact sources you find. For example, fluorescent lights can be replaced with fixtures that produce less 50/60Hz noise.
(8) remove unused sensor cables from the encoder to not function as an antenna for 50/60Hz artifact.
(9) position the electroencephalograph and electrode cable to reduce artifact reception. Use the location and angle that yield the lowest readings when not attached to a patient (Thompson & Thompson, 2015).
The Effect of Electrode Location on Common Mode Rejection
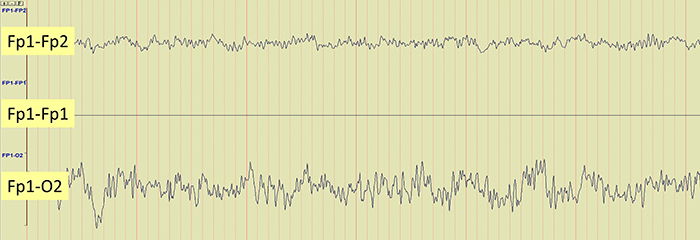
Brain activity is more similar when electrodes are close together and less similar when they are farther apart. This means that a differential amplifier may reject actual EEG voltages detected by adjacent electrodes. The sensors were placed at the same anatomical location (Fp1-Fp1) for maximum cancellation, as shown by the flat line in the recording below.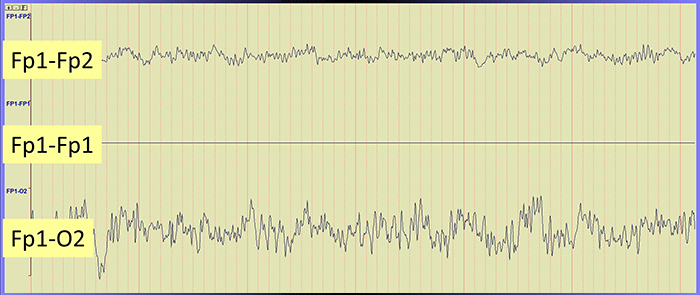
Differential Input Impedance
An amplifier’s differential input impedance further reduces the effect of unequal impedances. As EEG signals enter the amplifier, they are dropped across a network of resistors, presenting a differential input impedance in the Gohm (billion ohms) range. State-of-the-art instruments now exceed 10 Gohms. The differential input impedance must be at least 100 times skin-electrode impedance so that 99% or more of the signal can reach the electroencephalograph.Why is this important? Stronger signals help an amplifier differentiate EEG activity from noise, producing more accurate feedback.
Sampling the EEG Signal
An analog-to-digital (A/D) converter samples the EEG signal at a fixed sampling interval. The sampling rate is the number of measurements taken within a given period. The sampling rate must be high enough to represent the signal being measured accurately.According to the Nyquist-Shannon sampling theorem, an A/D converter's sampling rate should be at least twice the highest frequency component you intend to sample.
The American Clinical Neurophysiology Society (ACNS) guidelines recommend a minimum sampling rate of at least three times the high-frequency filter setting for digitization. This means at least 100 samples per second (sps) for a 35-Hz high-pass filter and at least 200 sps for a 70-Hz high-pass filter (Halford et al., 2016).
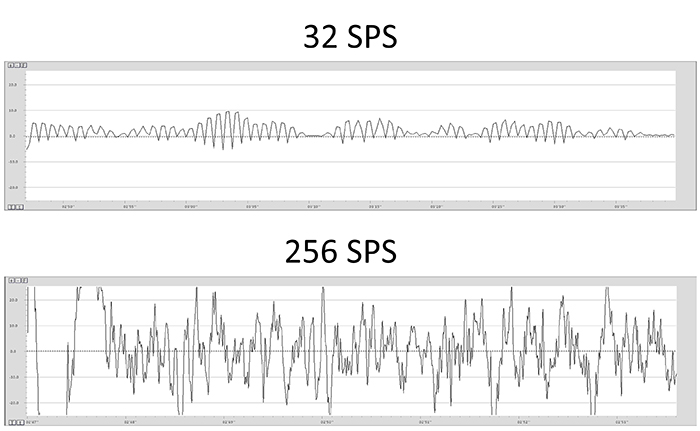
A sampling rate of 128 sps is acceptable for visual inspection of the EEG. A rate of 256 sps is typical, and rates from 500-1000 sps are preferred. The graphic below shows the same EEG signal sampled at 32 and 256 sps. The vertical scale (signal amplitude) is identical for both rates.
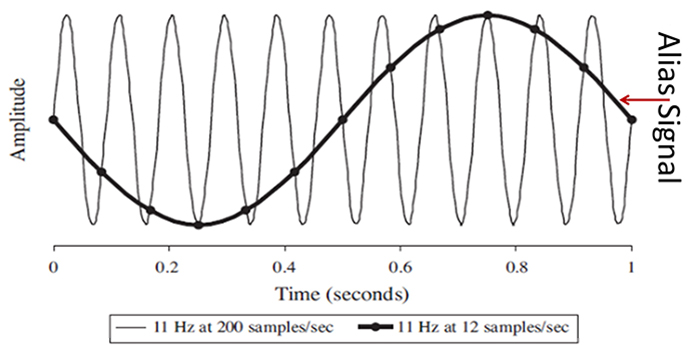
Sampling at rates that are too slow results in aliasing where an analog signal seems to have a lower frequency than it does. In the graphic below © Johns Hopkins University Press, "phantom" slow activity results from too few samples per second. An 11-Hz signal is sampled at 12 and 200 sps. The 12-sps rate produces an aliasing signal shown in black.
Resolution Depends on Bit Depth
An A/D converter's resolution is limited by the smallest signal amplitude it can sample. A bit number is the number of voltage levels that an A/D converter can discern. ACNS (Halford et al., 2016) recommends a 16-bit resolution, which can discriminate among 65,536 voltage levels and achieve 0.05-μV resolution. Lower A/D converter resolutions overemphasize small voltage increases.Signal Properties
EEG signals may be described by their frequency and amplitude. A/D conversion utilizes digital filters to break the EEG into its component frequencies.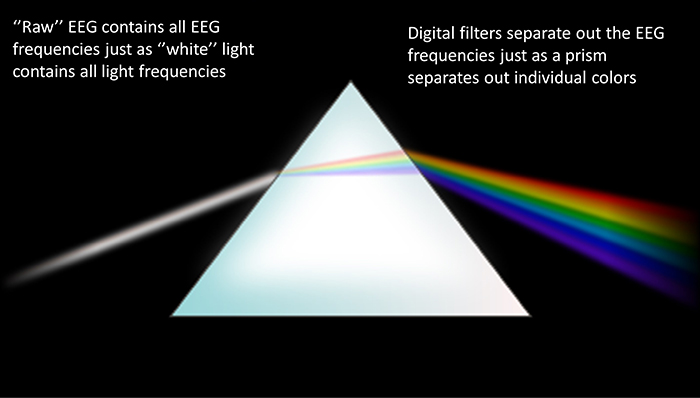
The movie below is a 19-channel BioTrace+ /NeXus-32 display of EEG activity from 1-64 Hz activity broken into component delta, theta, alpha, and beta frequency bands by digital filters © John S. Anderson.
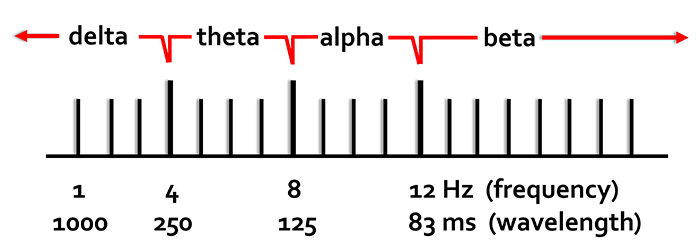
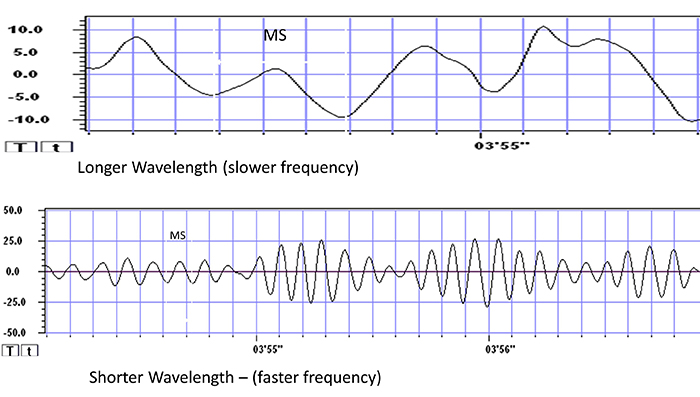
Recall that frequency is the number of cycles completed each second (Hz). The longer the wavelength, the slower the frequency. The delta, theta, alpha, and beta bands can be defined by wave frequency and wavelength, as shown in this graphic.
The next graphic illustrates the inverse relationship between wavelength and frequency. The time scale on the horizontal axis is in milliseconds. The amplitude scales are different for the upper (-10 to 10 μV) and lower (-50 to +50 μV) tracings.
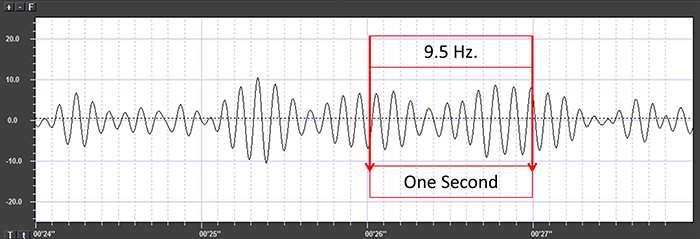
The graphic below shows a 9.5-Hz alpha wave. There are 9.5 peaks during a second.
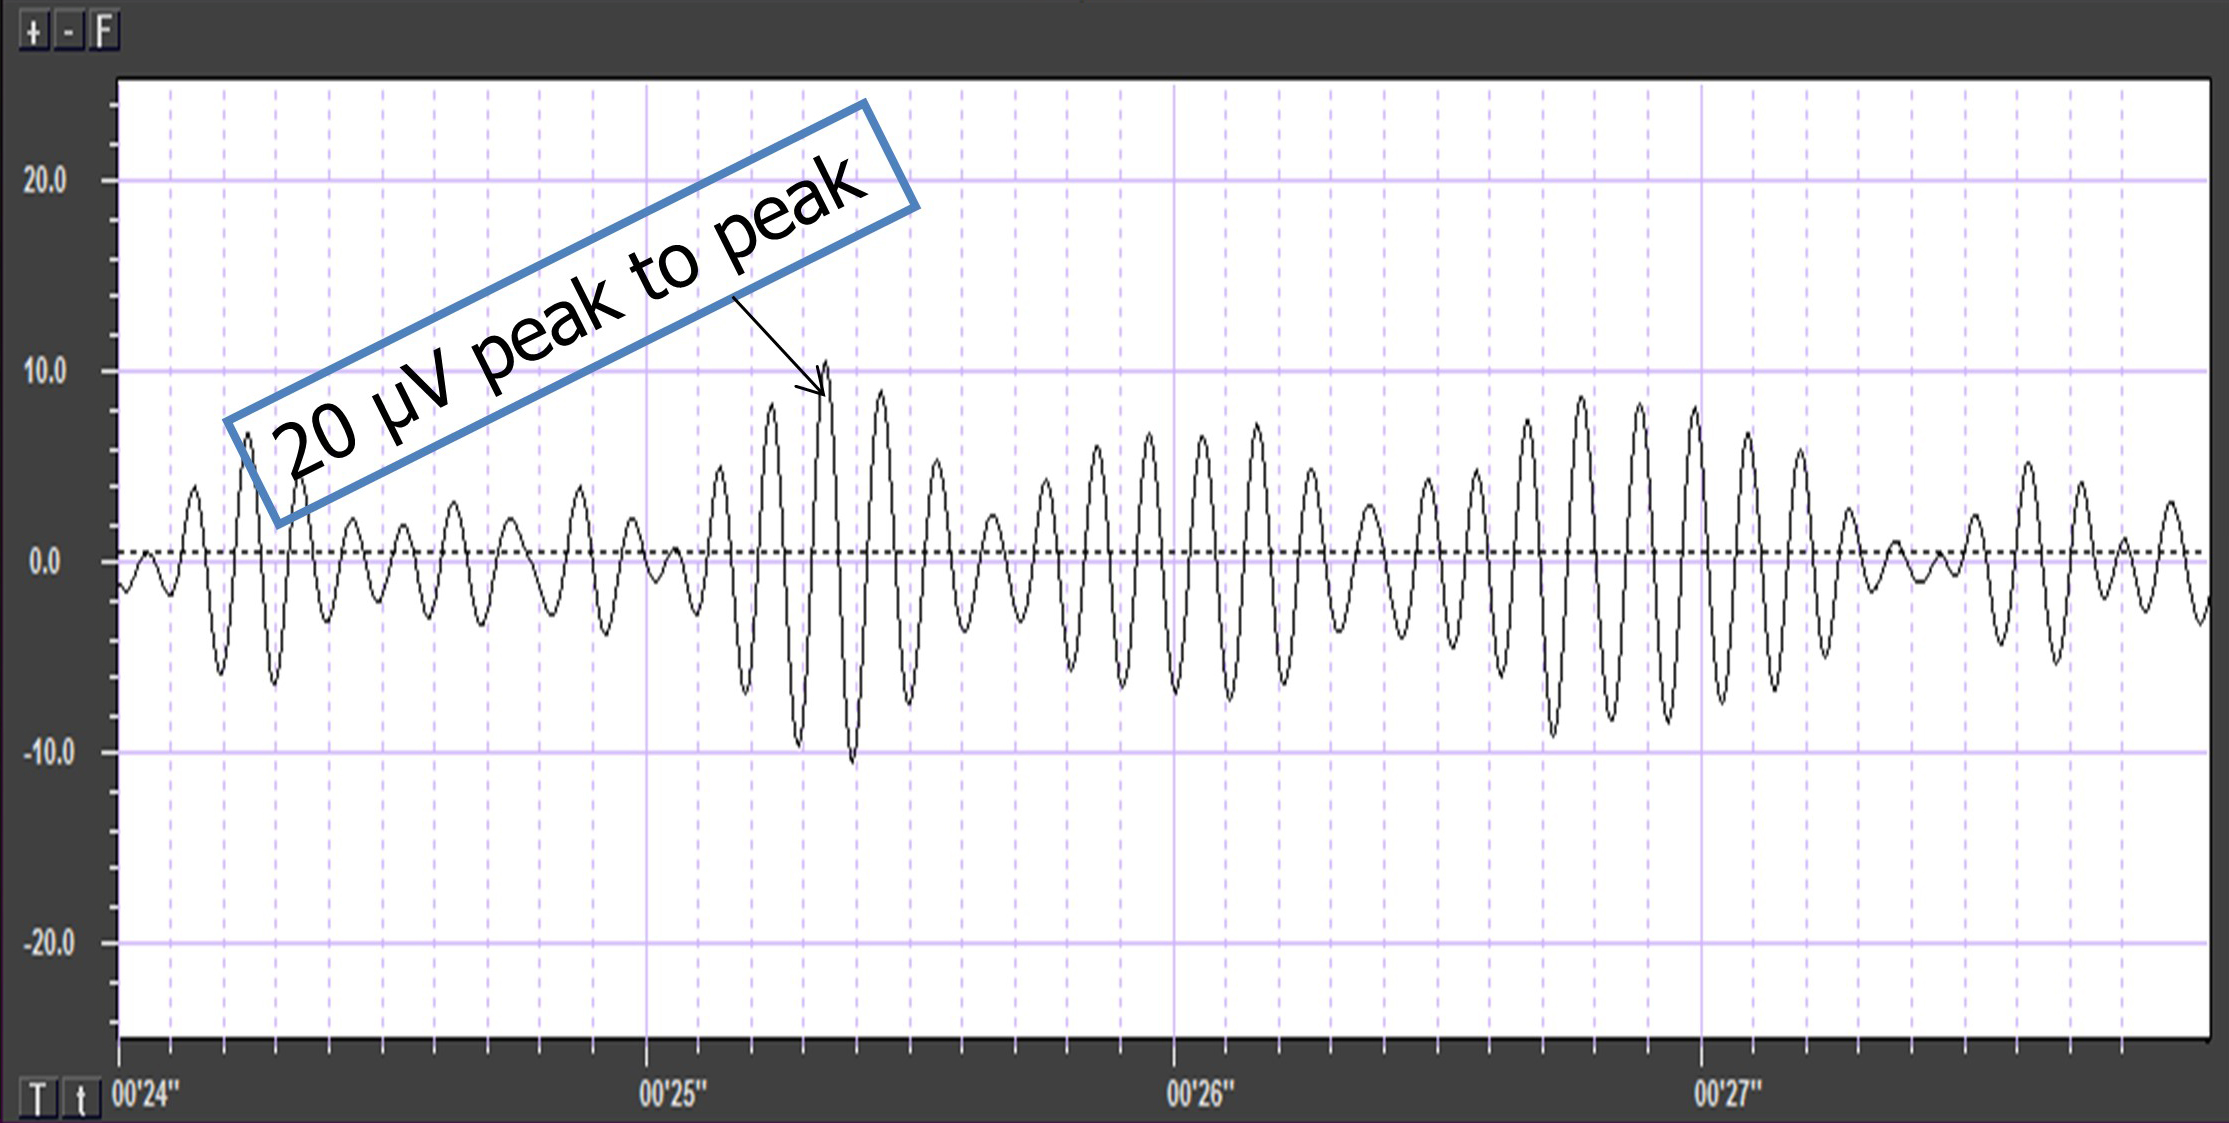
Also, recall that amplitude is signal voltage or power and is measured in microvolts or picowatts. The alpha wave below has a 20-μV amplitude.
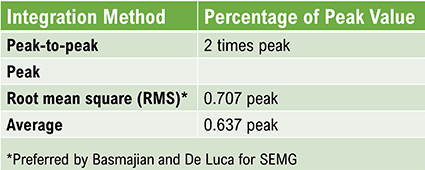
The EEG signal is sent to an integrator to measure signal amplitude in microvolts (μV) or picowatts. Integrators use four methods to calculate the voltage. The peak-to-peak method provides the largest estimate, equivalent to the energy contained between the positive and negative maximum values of the original AC waveform, which is 2 times the peak value. Peak voltage is 0.5 of the peak-to-peak value. Root mean square (RMS) voltage is 0.707 of the peak value and 20% higher than the average voltage. Average voltage is 0.637 of the peak value. The graphic below illustrates the peak, peak-to-peak, and root mean square integration methods.
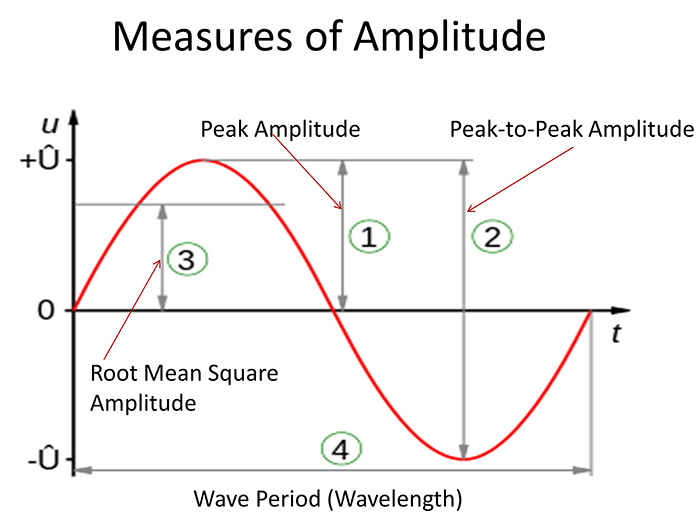
Conversion among these methods is straightforward. If the peak-to-peak voltage is 20 μV, peak voltage is 10 μV, root mean square voltage is 7.07 μV, and average voltage is 6.37 μV.
EEG Filters Define the Signal
EEG filters select signals of interest and minimize artifacts. In this section, we will review high-pass, low-pass, bandpass, and notch filters. In the graphic below, the range of frequencies passed through a filter is called the passband, and the range that is sharply attenuated is called the stopband.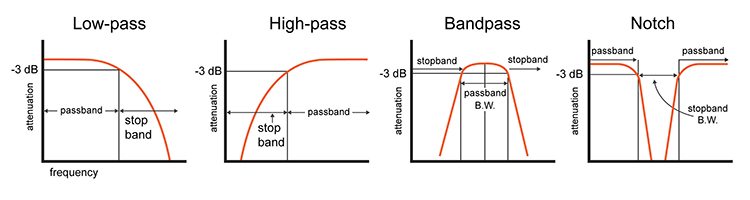
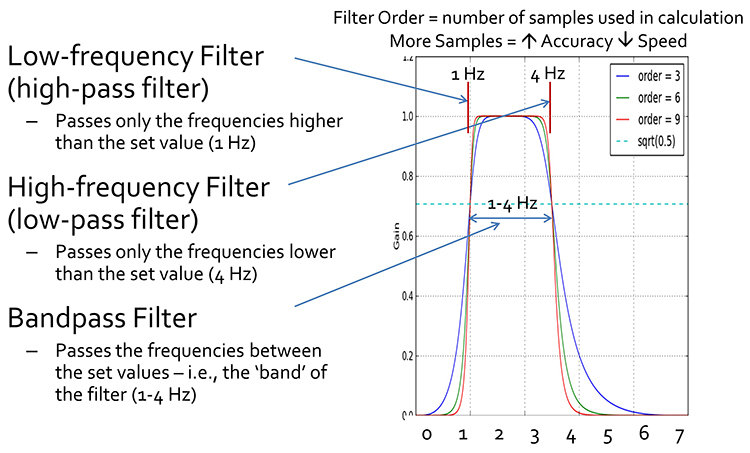
A high-pass filter only passes frequencies higher than a set value (e.g., 1 Hz). A low-pass filter only passes frequencies lower than a specified value (e.g., 40 Hz). A bandpass filter passes frequencies between the set values, the "band" of the filter (e.g., 1-40 Hz).
10-Hz Low-Pass Filter
The movie below shows the output of a 10-Hz low-pass filter with a vertical scale of 0-50 μV © John S. Anderson.
20-Hz Low-Pass Filter
The movie below shows the output of a 20-Hz low-pass filter with a vertical scale of 0-50 μV © John S. Anderson.
30-Hz Low-Pass Filter
The movie below shows the output of a 30-Hz low-pass filter with a vertical scale of 0-50 μV © John S. Anderson.
40-Hz Low-Pass Filter
The movie below shows the output of a 40-Hz low-pass filter with a vertical scale of 0-50 μV © John S. Anderson.
10-Hz High-Pass Filter
The movie below shows the output of a 10-Hz high-pass filter with a vertical scale of 0-50 μV © John S. Anderson.
20-Hz High-Pass Filter
The movie below shows the output of a 20-Hz high-pass filter with a vertical scale of 0-50 μV © John S. Anderson.
30-Hz High-Pass Filter
The movie below shows the output of a 30-Hz high-pass filter with a vertical scale of 0-50 μV © John S. Anderson.
Bandpass Filters
1-40-Hz Bandpass Filter
The movie below shows the output of a 1-40-Hz bandpass filter with a vertical scale of 0-50 μV © John S. Anderson.
8-12-Hz Bandpass Filter
The movie below shows the output of an 8-12-Hz bandpass filter with a vertical scale of 0-50 μV © John S. Anderson.
The movie below shows the output of three bandpass filters for delta, theta, and alpha © John S. Anderson.
The movie below generously provided by John S. Anderson shows a "raw" or "wave" display of oscillating electrical information using a positive/negative scale with 0.0 in the middle with the voltage displayed as peak-to-peak μV.
The movie © John S. Anderson shows the same alpha waveform plotted along two scales. The top display plots the waveform on a scale that ranges from -20 to +20 μV. The bottom "amplitude" display plots the voltage on a scale that ranges from 0- 50 μV where all values are positive.
The movie © John S. Anderson shows the conversion of the complex EEG signal into its spectral components.
The movie © John S. Anderson shows the spectrum magnitude (average amplitude over a given time) in the top display and power (μV2) in the bottom display.
The movie © John S. Anderson shows the same alpha activity displayed in terms of amplitude (positive voltages), power or amplitude2 (picowatts/resistance), and percent power (signal power as a percentage of total EEG power from 0-100%).
Notch Filter
A notch filter suppresses a narrow band of frequencies produced by line current (e.g., 50/60Hz artifact), as shown below by a graphic by Neupsy Key. Use notch filters as a last resort.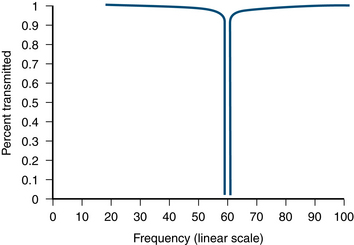
The narrated video below © John S. Anderson displays the same 21-channel recording viewed using different montages with a 60-Hz notch filter on and off.
Digital Filters
Digital filters use digital processors, like a digital signal processing (DSP) chip, to exclude unwanted frequencies. First, an analog-to-digital converter (ADC) samples and digitizes the analog signal, representing signal voltages as binary numbers. Second, a DSP chip performs calculations on the binary numbers. Third, a digital-to-analog converter (DAC) may transform the sampled, digitally-filtered signal back to analog form.Three main methods of digital filtering are Fast Fourier Transformation (FFT), finite impulse response (FIR), and infinite impulse response (IIR).
FFT filters convert the EEG signal into a set of sine waves that vary in frequency, amplitude, and phase.
FIR filters have a finite-duration impulse response and calculate a moving weighted average of digitally-sampled voltages.
IIR filters have an infinite impulse response and employ feedback to calculate a moving weighted average of digitally-sampled voltages.
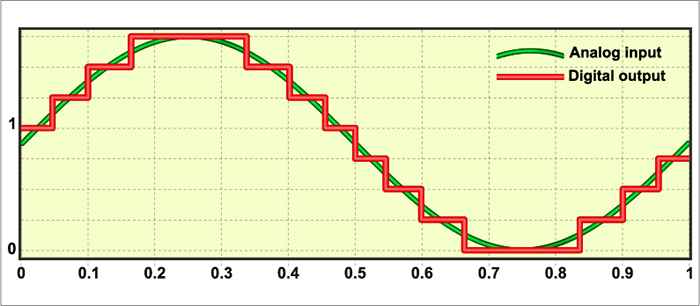
FFT, FIR, and IIR methods enjoy four advantages over analog filters. First, a clinician can retrospectively adjust the filter settings as they review the EEG record since digital filters are programmable. Second, digital filters can be designed to minimize phase distortion (displacement of the EEG waveform in time). Third, digital filters are stable over time and across a range of temperatures. Fourth, digital filters accurately process low-frequency signals. Graphic © Fouad A. Saad/Shutterstock.com shows the digital reconstruction of an analog waveform.
Since these three digital filtering methods can yield different statistical values, they cannot be used interchangeably. Only compare FFT statistics with themselves and not FIR or IIR statistics (Thompson & Thompson, 2016).
Below is a BioGraph ® Infiniti EEG three-dimensional FFT display. Frequency is displayed on the X-axis, amplitude on the Y-axis, and time on the Z-axis.
Safety Precautions
Like computer-based data acquisition systems, line-powered equipment can expose both a client and practitioner to shock hazards. Both should avoid contact with metal surfaces, and water spills should be immediately cleaned up. Graphic © DenisNata/Shutterstock.com.
Exposure to Current Can Injure and Cause Death
A 1-second exposure to a current exceeding 5 mA can injure. An 18-mA current can affect breathing. A 50-mA current can cause fatal ventricular fibrillation in which the heart chambers cannot pump blood (Peek, 2016). Animation © 2010 Scholarpedia.
Biomedical engineers prevent shock hazards through ground fault interrupt circuits, optical isolation, fiber optic connections, and telemetry. Graphic © Sergey Nivens/Shutterstock.com.
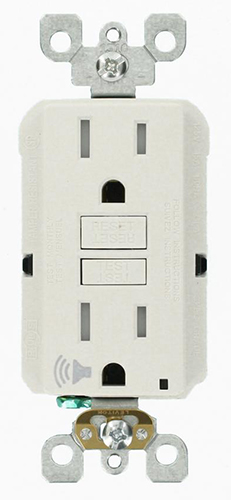
Ground Fault Interrupt Circuit
A ground fault interrupt circuit is designed into some power outlets to shut down power when a short circuit occurs. This protective circuit monitors current leakage. When harmful leakage is detected (> 5 mA), it triggers a circuit breaker that shuts off power to the equipment, protecting the client, therapist, and hardware.Montgomery (2004) recommended plugging the entire biofeedback system into the same power outlet to create a common ground so that current leakage in any of your equipment will trigger the ground fault interrupt circuit.
Optical Isolation
Optical isolation protects a client from hardware receiving AC power. An optical isolator (opto-isolator) converts a biological signal into a beam of light using an LED source, the light crosses a dialectic barrier (insulation) located in the center (open circuit), and a phototransistor reconverts the light into an electrical signal.
Fiber Optic Connections
Fiber optic connections, thin, flexible cables that transmit digital signals as pulses of light, transmit photons between the electrodes and data acquisition system. This prevents current from leaking from a computer to a client since electrons cannot travel through fiber optic cables. This approach also reduces contamination by electrical artifacts like power line noise.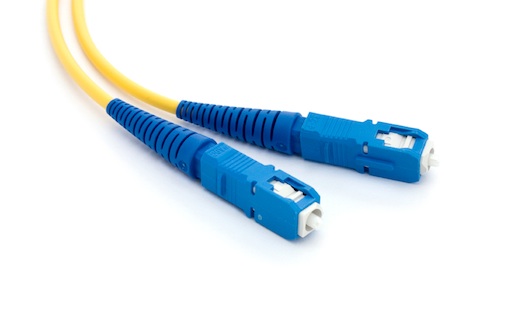
Telemetry
Telemetry can wirelessly transmit physiological data from a battery-powered encoder unit to a computer many meters away. This technology protects clients from shock since current surges cannot travel across a Bluetooth connection (Montgomery, 2004).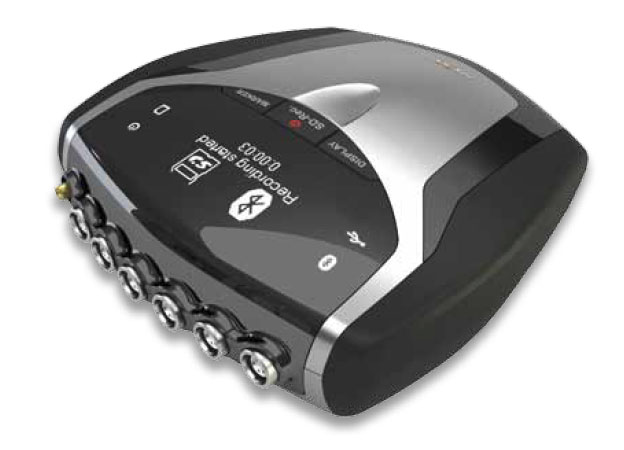
Glossary
active electrode: the electrode that is placed over a site that is a known EEG generator like Cz.
alpha blocking: the replacement of the alpha rhythm by low-amplitude desynchronized beta activity during movement, attention, mental effort like complex problem-solving, and visual processing.
alternating current (AC): an electric current that periodically reverses its direction.
ampere (A): the unit of electrical current or the flow rate of electrons through a conductor. One volt dropped across one ohm of resistance produces a current flow of one ampere.
amplitude: the strength of the EMG signal measured in microvolts or picowatts.
analog-to-digital converter (ADC): an electronic device that converts continuous signals to discrete digital values.
artifact: false signals like 50/60Hz noise produced by line current.
atom: the basic unit of matter consisting of a central nucleus that contains protons and neutrons and orbiting electrons.
atomic number: the number of protons in the nucleus of an atom that defines an element.
atomic weight: the approximate number of protons and neutrons in the nucleus of an atom.
average voltage: 0.637 of the peak voltage.
bandpass filter: the filter that passes frequencies between the set values, the "band" of the filter (e.g., 1-40 Hz).
behavioral test (tracking test): a test of the entire signal chain (EEG sensor, differential amplifier, gain amplifier, cable, encoder, and computer) performance by asking a client to act and then observing the effects on the EEG.
bias potential: spurious voltage produced by the exchange of metal ions donated by the electrodes and electrolytes in the absence of a biological current.
bipolar recording: a recording method that uses two active electrodes and a common reference.
bit number: the number of voltage levels that an A/D converter can discern. A resolution of 16 bits means that the converter can discriminate among 65,536 voltage levels.
charge (Q): the imbalance between the number of positively and negatively charged particles in a given place or between two locations.
closed circuit: a complete path that allows electrons to travel from the power source, through the conductor and resistance, and back to the source.
common-mode rejection ratio (CMRR): the degree by which a differential amplifier boosts signal (differential gain) and artifact (common-mode gain).
conductance (G): the ability of a material like copper or silver to carry an electric current. Conductance is measured in siemens (formerly mhos).
conductor: a material that readily allows electron movement like a copper wire.
continuity test: a procedure to ensure that a circuit is closed. For example, a cable is not broken.
coulomb: approximately 6.24 x 10¹⁸ or 6 billion billion electrons.
current (I): the movement of electrons through a conductor measured in amperes (A).
DC offset: the voltage that results from combinations of factors including electrode and gel/paste materials, interactions with skin, environment (humidity and temperature), and sweat gland activity due to stress level.
differential amplifier (balanced amplifier): a device that boosts the difference between two inputs: the active (input 1) and reference (input 2).
differential input impedance: the opposition to an AC signal entering a differential amplifier as it is dropped across a resistor network.
digital filter: device that mathematically removes unwanted or extracts valuable aspects of a sampled, discrete-time signal.
direct current (DC): an electric current that flows in only one direction, as in a flashlight.
electrode: a specialized conductor that converts biological signals like the EEG into currents of electrons.
electromotive force (EMF): a difference in electrical potential that "pushes" electrons to move in a circuit.
electron: a negatively-charged particle that rotates around the nucleus at varying distances and participates in chemical reactions.
elements: substances that contain identical atoms and cannot be reduced by common chemical reactions.
energy level: one of an electron's possible orbits around a nucleus at a constant distance.
epidermis: the outermost skin layer.
fiber optic cable: a thin, flexible cable that transmits digital signals as pulses of light with the advantages of high-speed data transmission, electrical isolation, and resistance to electromagnetic interference.
finite impulse response (FIR) filter: filter with a finite-duration impulse response.
frequency (Hz): the number of complete cycles that an AC signal completes in a second, usually expressed in hertz.
gain: an amplifier's ability to increase the magnitude of an input signal to create a higher output voltage; the ratio of output/input voltages.
ground electrode: a sensor placed on an earlobe, mastoid bone, or the scalp that is grounded to the amplifier.
ground fault interrupt circuit: a protective device that opens a circuit—shutting down power—when current leakage exceeds 5 mA.
hertz (Hz): the unit of frequency measured in cycles per second.
high-pass filter: a filter that only passes frequencies higher than a set value (e.g., 1 Hz).
impedance (Z): complex opposition to an AC signal measured in Kohms.
impedance meter: device that uses an AC signal to measure impedance in an electric circuit, such as between active and reference electrodes.
impedance test: the automated or manual measurement of skin-electrode impedance.
infinite impulse response (IIR) filter: a filter with an infinite impulse response and employ feedback as they calculate a moving weighted average of digitally-sampled voltages.
input sensitivity: the maximum voltage level an amplifier can accept without producing clipping and distortion.
insulator: material that resists the flow of electricity like glass and rubber.
interstitial fluid: fluid between cells through which biological signals travel via volume conduction.
ion: an atom or molecule with a positive or negative electrical charge.
low-pass filter: a filter that only passes frequencies lower than a set value (e.g., 40 Hz).
mastoid bone (or process): bony prominence behind the ear.
mho: the unit of conductance replaced by the siemen.
microsiemen (μS): the unit of conductance that is one-millionth of a siemen.
microvolt (μV): the unit of amplitude (signal strength) that is one-millionth of a volt.
milliampere (mA): unit of electrical current that is one-thousandth of an ampere.
millivolt (mV): unit of amplitude (signal strength) that is one-thousandth of a volt.
monopolar recording: a recording method that uses one active and one reference electrode.
motor unit: an alpha motor neuron and the skeletal muscle fibers it innervates.
notch filter: a filter that suppresses a narrow band of frequencies, such as those produced by line current at 50/60Hz.
nucleus: central mass of an atom that contains protons and neutrons.
Nyquist-Shannon sampling theorem: the perfect reconstruction of the analog signal requires sampling at two times its highest frequency. A signal whose highest frequency is 1000 Hz should be sampled 2000 times per second.
ohm (Ω): the unit of impedance or resistance.
Ohm's law: voltage (E) = current (I) X resistance (R). The “amount” of current (I) flowing through a conductor is equal to the voltage (E) or “push” divided by the resistance (R).
open circuit: an incomplete path that prevents electron movement from the power source, through the conductor, and back to the source. For example, a broken sensor cable.
optical isolation: a device that converts a biological signal into a beam of light, the light crosses a gap (open circuit), and a photoreceptor reconverts the light into an electrical signal.
passband: the range of frequencies that is passed through a filter.
peak voltage: 0.5 of the peak-to-peak voltage.
peak-to-peak voltage: the voltage contained between the positive and negative maximum values of the original AC waveform.
phase: the degree to which the peaks and valleys of two waveforms coincide.
phase distortion: the displacement of the EEG waveform in time.
picowatt: billionths of a watt.
polarization: chemical reactions produce separate regions of positive and negative charge where an electrode and electrolyte make contact, reducing ion exchange.
power (W): the rate at which energy is transferred, which is proportional to the product of current and voltage. Power is measured in watts.
proton: positively charged subatomic particle found in the nucleus of an atom.
Quantitative EEG (qEEG): digitized statistical brain mapping using at least a 19-channel montage to measure EEG amplitude within specific frequency bins.
reference electrode: the electrode placed over a less-electrically active site like the mastoid bone behind the ear.
resistance (R): the opposition to a DC signal by a resistor measured in ohms.
resistor: a component in electric circuits that resists current flow.
resolution: degree of detail in a biofeedback display (0.1 μV) or the number of voltage levels that an A/D converter can discriminate (16 bits or discrimination among 65,536 voltage levels).
root mean square (RMS) voltage: 0.707 of the peak voltage.
short circuit: a lower-resistance electrical circuit created by the unintended contact between components that accidentally diverts the current.
skin conductance level (SCL): a tonic measurement of how easily an AC or DC passes through the skin, expressed in microsiemens.
skin resistance level (SRL): a tonic (resting) measurement of the opposition to an AC or DC as it passes through the skin, expressed in Kohms.
stopband: the range of frequencies that is sharply attenuated by a filter.
superconductor: a material that conducts electricity without resistance.
telemetry: remote monitoring and transmission of information. An encoder measures physiological activity and transmits these data to a computer for analysis.
tracking test (behavioral test): a test of the entire signal chain (EEG sensor, differential amplifier, gain amplifier, cable, encoder, and computer) performance by asking a client to act and then observing the effects on the EEG.
transducer: device that transforms energy from one form to another. Electrodes convert ionic potentials into electrical potentials.
ventricular fibrillation: a medical emergency in which the lower heart chambers contract in a rapid and unsynchronized fashion and cannot pump blood.
volume conduction: the movement of biological signals through interstitial fluid.
volt (V): unit of electrical potential difference (electromotive force) that moves electrons in a circuit.
voltage (E): the amount of electrical potential difference (electromotive force).
voltohmmeter: a device that uses a DC signal to measure resistance in an electric circuit, such as between active and reference electrodes.
watt (W): a unit of power used to express signal strength in the qEEG.
REVIEW FLASHCARDS ON QUIZLET
Click on the Quizlet logo to review our chapter flashcards.

Assignment
Now that you have completed this module, explain why low-and-balanced skin-electrode impedances are important in neurofeedback training. Describe the precautions you take to achieve acceptable impedance values. How do you measure impedance with your neurofeedback system?
References
Andreassi, J. L. (2000). Psychophysiology: Human behavior and physiological response. Lawrence Erlbaum and Associates, Inc.
Basmajian, J. V. (Ed.). (1989). Biofeedback: Principles and practice for clinicians. Williams & Wilkins.
Cacioppo, J. T., & Tassinary, L. G. (Eds.). (1990). Principles of psychophysiology. Cambridge University Press.
Collura, T. F. (2014). Technical foundations of neurofeedback. Taylor & Francis.
Demos, J. N. (2005). Getting started with neurofeedback. W. W. Norton & Company.
Fisch, B. J. (1999). Fisch and Spehlmann's EEG primer (3rd ed.). Elsevier.
Floyd, T. L. (1987). Electronics fundamentals: Circuits, devices, and applications. Merrill Publishing Company.
Grant, A. (2015). Four elements earn permanent seats on the periodic table. Science News.
Halford, J. J., Sabau, D., Drislane, F. W., Tsuchida, T. N., & Sinha, S. R. (2016). American Clinical Society Guideline 4: Recording clinical EEG on digital media. Journal of Clinical Neurophysiology, 33(4), 317-319. https://doi.org/10.1080/21646821.2016.1245563
Hughes, J. R. (1994). EEG in clinical practice (2nd ed.). Butterworth-Heinemann.
Kubala, T. (2009). Electricity 1: Devices, circuits, and materials (9th ed.). Cengage Learning.
Libenson, M. H. (2010). Practical approach to electroencephalography. Saunders Elsevier.
Miller, J. W., Kim, W. S., Homes, M. D., & Vanhatalo, S. (2007). Ictal localization by source analysis of infraslow activity in DC-coupled scalp EEG recordings. NeuroImage, 35(2), 583-597. https://doi.org/10.1016/j.neuroimage.2006.12.018
Montgomery, D. (2004). Introduction to biofeedback. Module 3: Psychophysiological recording. Association for Applied Psychophysiology and Biofeedback.
Nilsson, J. W., & Riedel, S. A. (2008). Electric circuits (8th ed.). Pearson Prentice-Hall.
Peek, C. J. (2016). A primer of traditional biofeedback instrumentation. In M. S. Schwartz, & F. Andrasik (Eds.). (2016). Biofeedback: A practitioner's guide (4th ed.). The Guilford Press.
Stern, R. M., Ray, W. J., & Quigley, K. S. (2001). Psychophysiological recording (2nd ed.). Oxford University Press.
Thompson, M., & Thompson, L. (2015). The biofeedback book: An introduction to basic concepts in applied psychophysiology (2nd ed.). Association for Applied Psychophysiology and Biofeedback.
Wadman, W. J., & Lopes da Silva, F. H. (2011). In D. L. Schomer & F. H. Lopes da Silva (Eds.). Niedermeyer's electroencephalography: Basic principles, clinical applications, and related fields (6th ed.). Lippincott Williams & Wilkins.
B. SIGNAL ACQUISITION
Clinicians monitor EEG activity using the classical International 10-20 System for standardized electrode placement or the modified "10-10" system known as the Modified Combinatorial Nomenclature System. They often record from several sites and measure the amplitude of EEG signals within frequency bands (like alpha and theta) to provide a complete picture of brain activity. Software-based montage reformatting allows clinicians to reanalyze session data by referencing an electrode to other sites or combinations of sites. This system also allows for the computation of multiple variables associated with communication and network functions within the central nervous system (CNS)
The Quantitative EEG (qEEG) measures EEG amplitudes within selected frequency bands. A full-cap 21-channel EEG recording (19 scalp sensors plus two "reference" sensors) and resulting qEEG analysis may be valuable in designing treatment protocols for complicated cases like Asperger's or traumatic brain injury. EEG topography displays the qEEG on a cortical surface map to show the spatial distribution of EEG activity.
Contamination of the EEG by physiological and exogeneous artifacts requires that clinicians take extensive precautions, examine the raw EEG record, and remove contaminated epochs through artifacting. Impedance tests and behavioral tests help ensure the fidelity of EEG recording.
Finally, clinicians interpret EEG recordings with an understanding of normal values and recognition of the effects of eye closure, age, diurnal influences, alertness and drowsiness, medication, and relaxation on these readings. Graphic © Medical-R/Shutterstock.com.
BCIA Blueprint Coverage
This unit addresses III. Instrumentation and Electronics - B. Signal Acquisition.
This unit covers International 10-20 and 10-10 Systems, Comparison of Neuroimaging Techniques, Using a Limited Number of Electrodes, Montage Options and Their Consequences, Recognizing and Correcting Signals of Noncerebral Origin, and Recognizing Normal EEG Patterns.
International 10-20 and 10-10 Systems
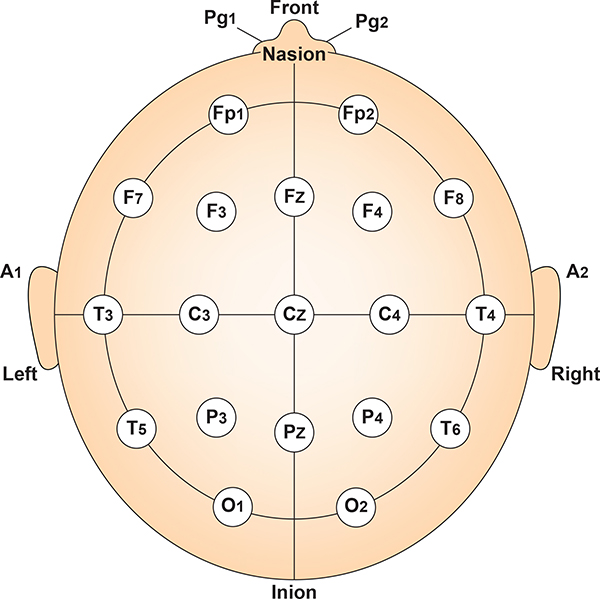
The International 10-20 system is a standardized procedure for electrode placement on 19 scalp and reference and ground sites. Electrodes measure electrical activity from a surrounding area the size of a quarter. The site recorded may be distant from the EEG generator due to neural pathways.
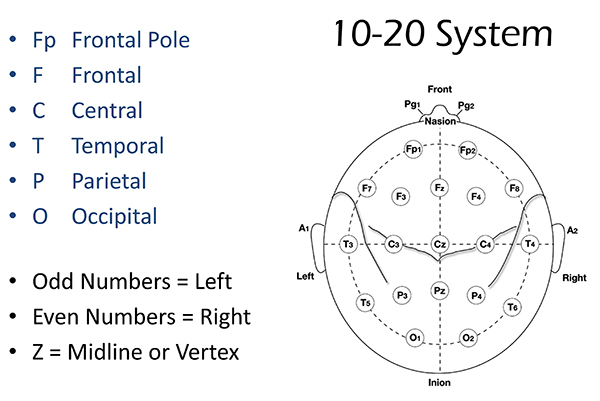
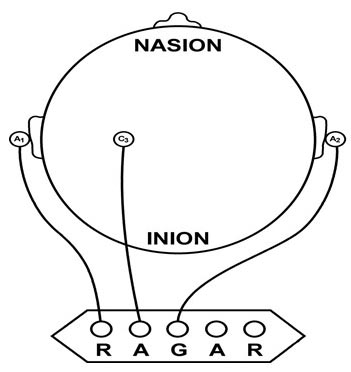
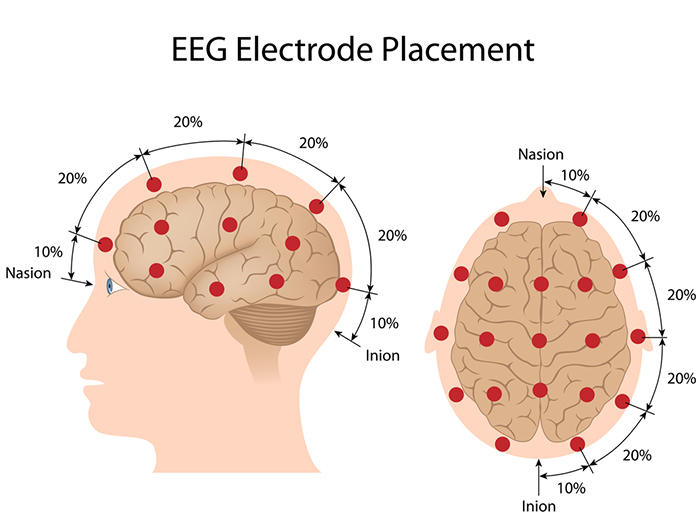
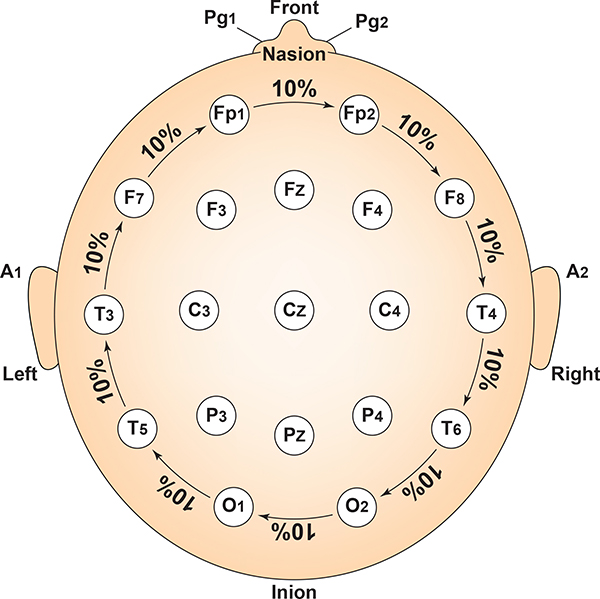
The International 10-20 system calculates the distance from the nasion to the inion and from the left preauricular notch to the right preauricular notch. The 19 active electrode positions are found taking either 10% or 20% of these distances. Check out the YouTube video The International 10-20 System. Four essential landmarks are the nasion, inion, preauricular points, and vertex. Graphic © Alila Medical Media/Shutterstock.com.
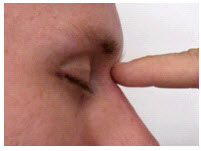
The nasion is the depression at the bridge of the nose.
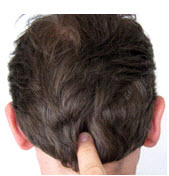
The inion is the bony prominence on the back of the skull in the middle of the inion ridge.
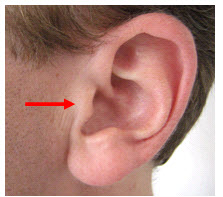
The left and right preauricular points are slight depressions located in front of the ears and above the earlobe. The flap at the opening of the ear is called the tragus.
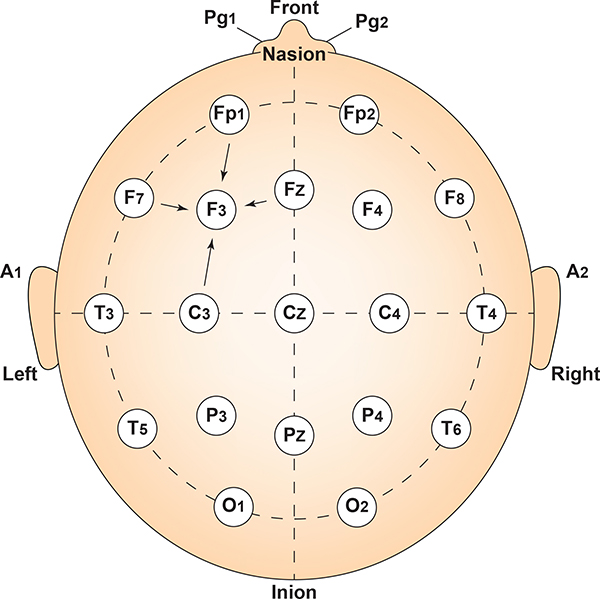
The vertex (Cz) is the intersection of imaginary lines drawn from the nasion to inion and between the two preauricular points. Cz is 50% of the total distance between the nasion and inion and 50% of the total distance between the two preauricular points. Minaanandag adapted the diagram below from Fisch (1999).
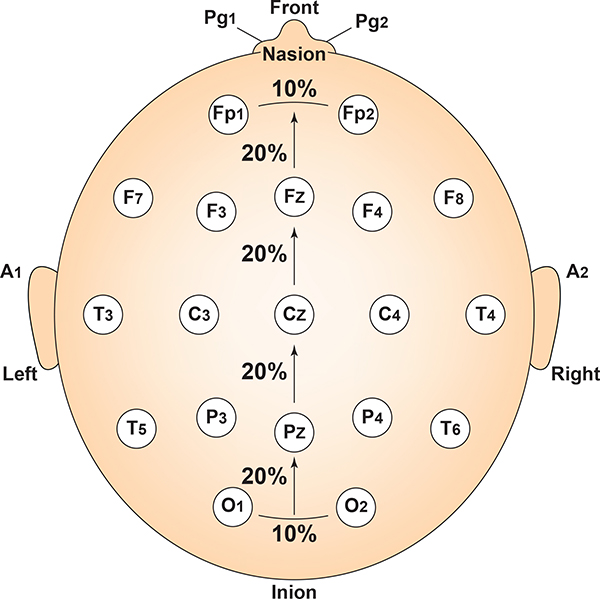
The 10-20 system received its name because electrode sites are separated by 10% or 20% of the distance between two corresponding anatomical landmarks. In the graphic below adapted from Fisch (1999) by minaanandag, each midline site is 10% or 20% of the distance from the nasion to the inion.
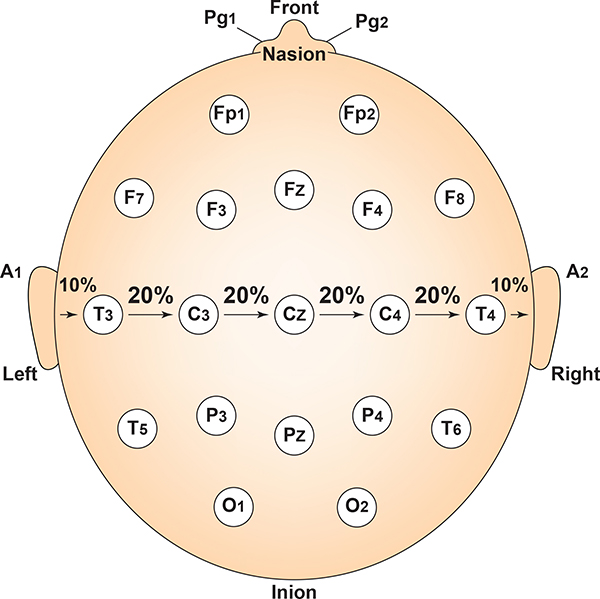
Each horizontal axis site is 10% or 20% of the distance from the two preauricular points. Graphic adapted from Fisch (1999) by minaanandag.
Each circumferential site is 10% of the total circumference, excluding Fpz or Oz. Graphic adapted from Fisch (1999) by minaanandag.
Intermediate sites are halfway between sets of adjacent sites. Graphic adapted from Fisch (1999) by minaanandag.
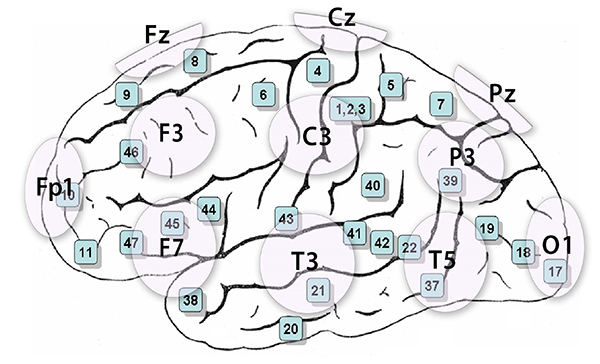
The graphic by Dailey (2013) shows the correspondence between 10-20 sites and Brodmann areas, which are 47 numbered cytoarchitectural zones of the cerebral cortex based on Nissl staining.
The 10-20 system assigns recording electrodes a letter and subscript. The letters represent the underlying region and include Fp (frontopolar or prefrontal), F (frontal), C (central), P (parietal), O (occipital), and A (auricular). A subscript of z represents a midline (central axis from nasion to inion) placement.
Numerical subscripts range from 1-8 and increase with distance from the midline. The 10-20 system assigns odd-numbered recording electrodes on the left and even-numbered electrodes on the right side of the head. Two reference electrodes are usually placed on the earlobe. John Balven adapted the diagram below from Fisch (1999).
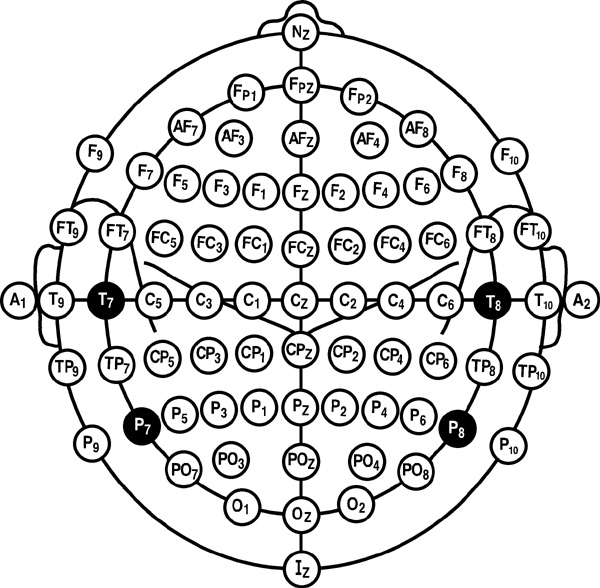
Modified Combinatorial Nomenclature
The American Clinical Neurophysiology Society published guidelines for expanding the 10-20 system to 75 electrode sites. This system, while more complex, also allows us to define more precisely the placement sites for our electrodes.The expansion of the 10-20 system allows clinicians to define the sites midway between two 10-20 sites commonly used in clinical practice, better localize epileptiform activity, increase EEG spatial resolution, and improve detection of localized evoked potentials. The modified combinatorial system replaces inconsistent designations (T3/T4 and T5/T6) with consistent ones (T7/T8 and P7/P8). Black circles depict these replacement sites with white lettering in the diagram below.
The modified combinatorial system, which is also called the 10-10 system, locates electrodes at every 10% along medial-lateral contours and adds new contours. Each electrode site is an intersection between a medial-to-lateral coronal line (designated by letters) and a longitudinal sagittal line (designated by numerical subscripts).
As with the 10-20 system, letters represent the underlying region and include: N (nasion), Fp (frontopolar or prefrontal), AF (anterior frontal), F (frontal), FT (frontotemporal), FC (frontocentral), A (auricular), T (temporal), C (central), TP (temporal-posterior temporal), CP (centroparietal), P (parietal), PO (posterior temporo-occipital or parieto-occipital), O (occipital), and I (inion). FT and FC lie along the second intermediate coronal line, TP and CP along the third, and PO along the fourth.
A subscript of z represents a midline (central axis from nasion to inion) placement. Numerical subscripts range from 1-10 and increase with distance from the midline. The modified combinatorial system assigns odd-numbered recording electrodes on the left, and even-numbered electrodes on the right side of the head David Kelsey adapted the diagram below from Fisch (1999).
Comparison of Neuroimaging Techniques
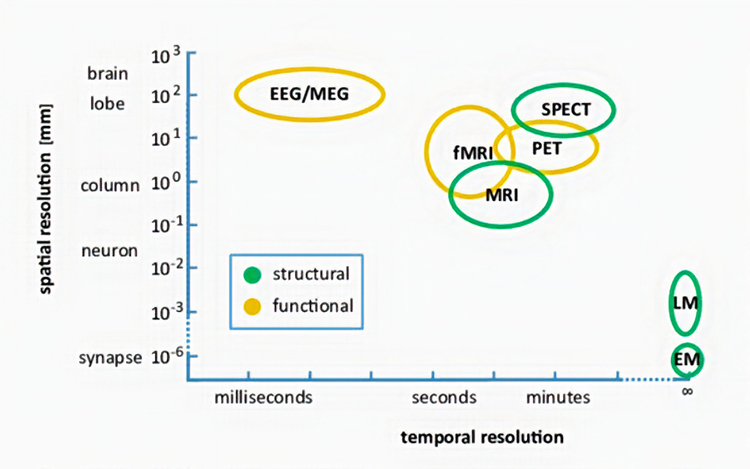
Neuroimaging methods can be thought of as either structural or functional. Structural methods include CT and MRI and present images of brain structures. Functional methods include EEG, MEG, fMRI, PET, and SPECT, each of which constructs images showing the location of differing levels of brain activity.
The different functional neuroimaging methods use different biologic signals as their index of function. EEG and MEG use brain electrical activity, fMRI uses blood oxygen level, PET uses positron-emitting radioisotopes bound to glucose, and SPECT uses gamma-emitting radioisotopes. Therefore, PET and SPECT are more invasive and pose more significant risks to patients and research participants (Breedlove & Watson, 2020).
Each functional neuroimaging method can be rated with respect to how quickly it can detect changes in function (temporal resolution) and over how small an area it detects changes in function (spatial resolution). Whereas EEG and MEG methods detect changes in function most quickly, they are less able to detect the precise area where functional changes occur compared to fMRI. Graphic from Pfister et al. (2012) © Mathematics and Visualization. EM = electron microscope and LM = light microscope.
STRUCTURAL TECHNIQUES
The main structural imaging techniques are computerized axial tomography and magnetic resonance imaging.Computerized Axial Tomography
Computerized Axial Tomography (CAT or CT) provides medium-resolution images of brain structure by moving an x-ray source along an arc surrounding the head (Breedlove & Watson, 2020). Watch the Blausen CAT Scans animation. Graphic © Tyler Olson/Shutterstock.com.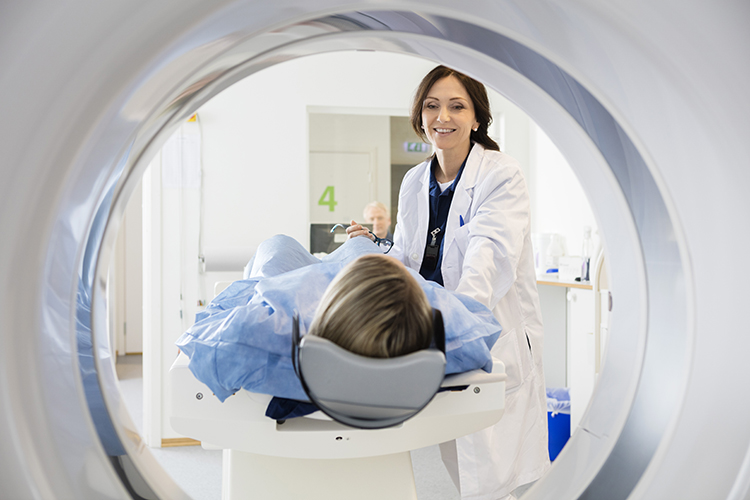
CT scans allow physicians to visualize structural abnormalities like stroke damage and tumors. Graphic © Triff/Shutterstock.com.
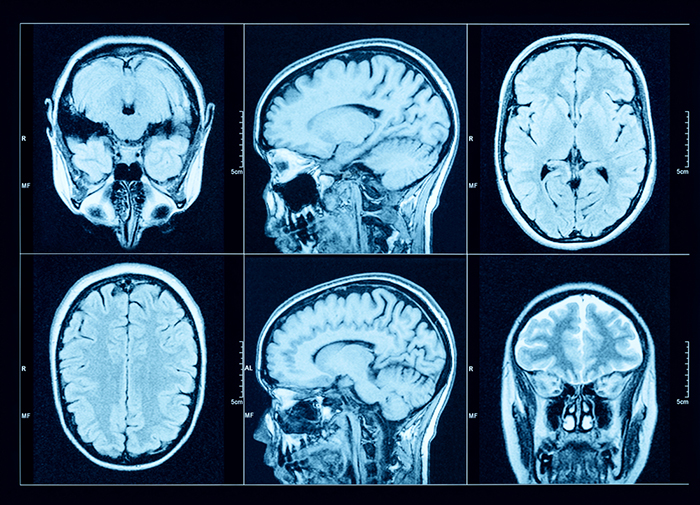
Magnetic Resonance Imaging (MRI)
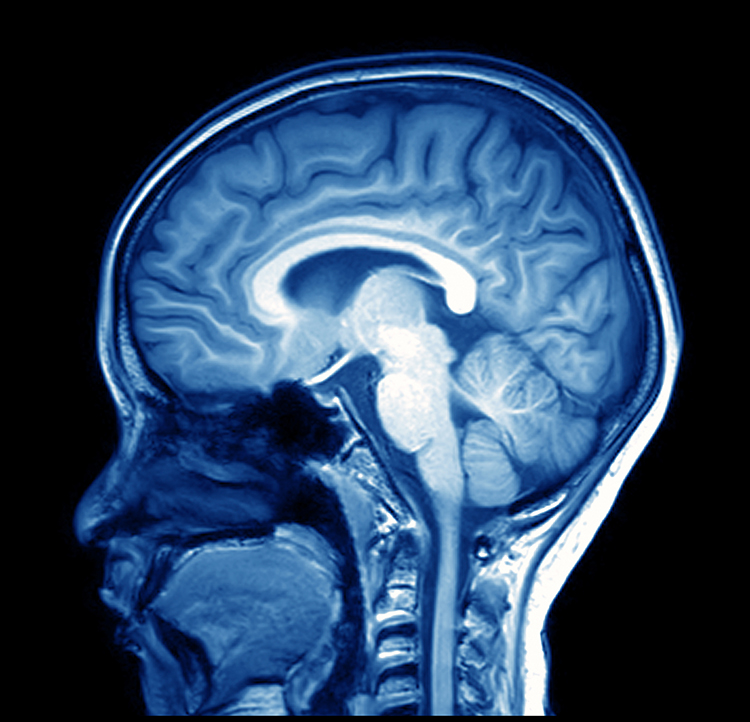
Magnetic resonance imaging (MRI) constructs higher-resolution images than CT scans. Since MRI scans use powerful magnetic fields and radio wave pulses to construct images of living brains, they are safer than CT scans because there is no radiation exposure. MRI scans allow a detailed examination of brain topography, including the location and volume of specific brain regions. Graphic © Peastock/Shutterstock.com.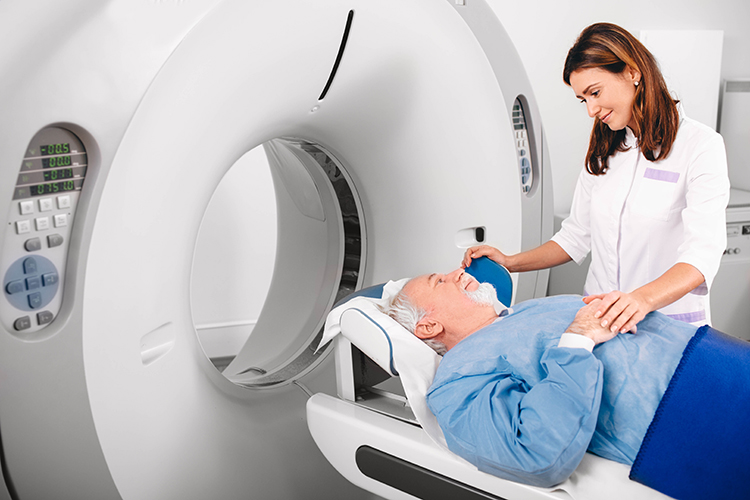
MRI scans' superior spatial resolution can detect demyelination in disorders like multiple sclerosis that CT scans would miss (Breedlove & Watson, 2020). Graphic © MriMan/Shutterstock.com.
FUNCTIONAL TECHNIQUES
Functional techniques reviewed in this section include the EEG and qEEG, magnetoencephalography (MEG), functional magnetic resonance imaging (fMRI), positron emission tomography (PET), and single-photon computerized emission tomography (SPECT). See Lebby (2013) for an excellent overview of these techniques. Also, consult the McGill brain imaging tool module.EEG
EEG and qEEG can be conceptualized as functional imaging techniques. A single-channel EEG performs “neuroimaging” by displaying an image of microvolts in adjacent 1-Hz bins or adjacent bands (e.g., a 2D spectrogram (shown below) or with a 3D spectrogram. Graphic © John S. Anderson.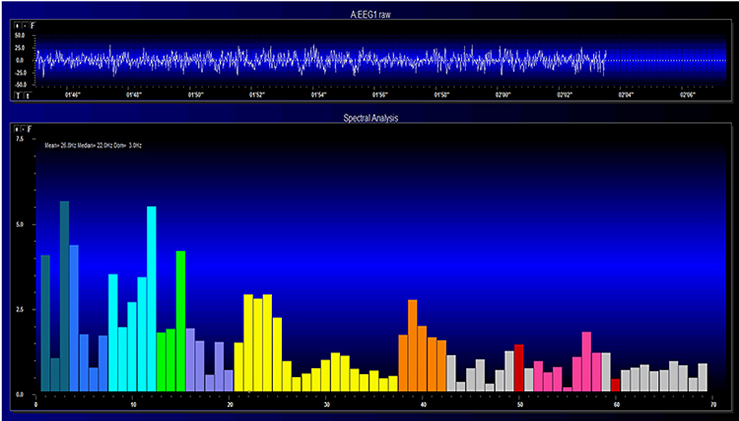
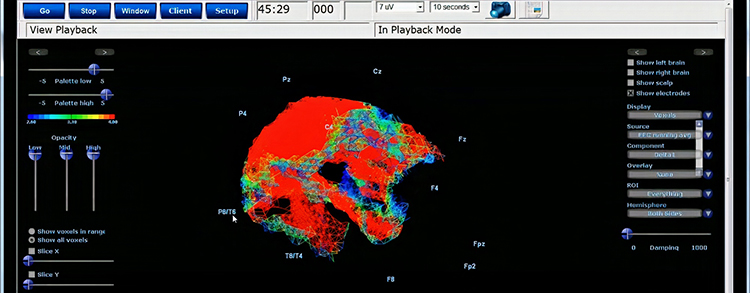
Further, 19-channel qEEG methods show images of activity as it is distributed across the brain’s convexity (i.e., over a 2D 10-20 map) or in 3 dimensions using more advanced qEEG methods (e.g., LORETA). Graphic courtesy of BrainMaster Technologies.
Magnetoencephalography
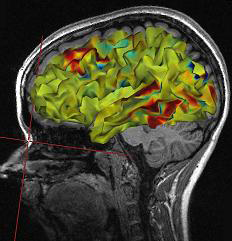
Magnetoencephalography (MEG) is a noninvasive functional imaging technique that uses SQUIDs (superconducting quantum interference devices) to detect the weak magnetic fields generated by neuronal activity. As with the EEG/qEEG, spatial resolution is inferior (cm compared to mm) to the functional MRI (fMRI) (Breedlove & Watson, 2017). Graphic © Steve Shoup/Shutterstock.com.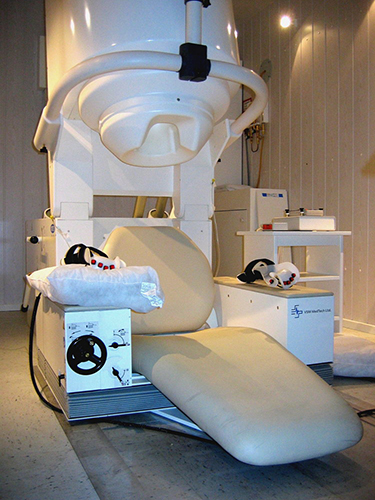
MEG's millisecond temporal resolution allows it to measure rapidly shifting patterns of cortical circuit activation (Breedlove & Watson, 2020). Researchers may combine MEG with MRI to better delineate the cortical structures generating the magnetic fields (Lin et al., 2004). The MEG graphic below is courtesy of the University of Montreal MEG Laboratory website.
Functional Magnetic Resonance Imaging (fMRI)
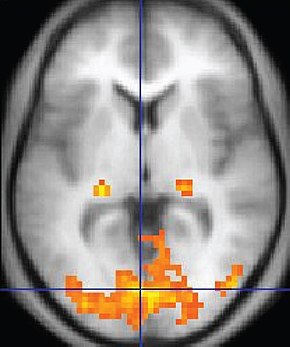
Functional Magnetic Resonance Imaging (fMRI)generates intense magnetic fields to detect brain regions' oxygen use during specific tasks indirectly.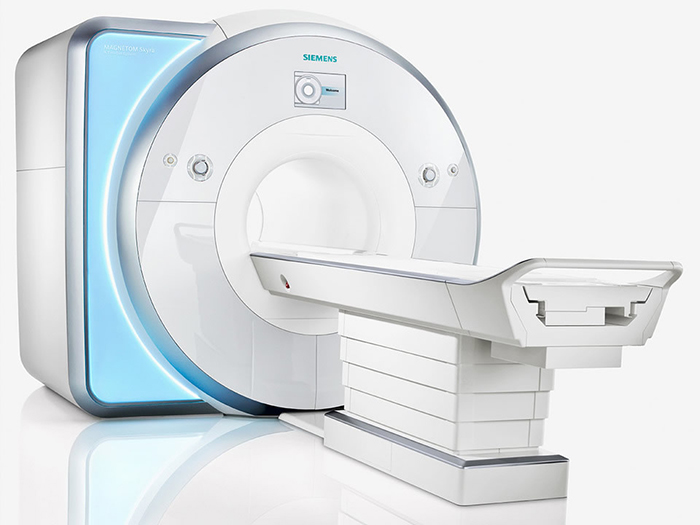
fMRI images represent communications from other neurons and changes in local potentials instead of action potentials. Although the fMRI is limited by significant (100-ms to several-s) delays, it can reveal network contribution to cognitive performance. The fMRI trades spatial resolution for PET's superior temporal resolution (Breedlove & Watson, 2020). A fMRI image © Wikipedia is shown below.
Watch the Blausen MRI animation.
Positron Emission Tomography
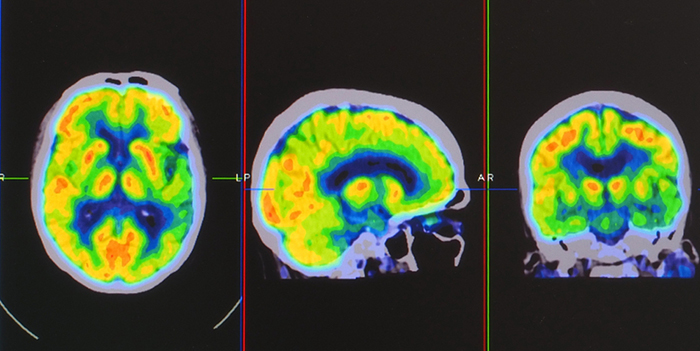
Positron emission tomography (PET) is a functional imaging technique that injects radioactive chemicals into the brain's circulation to measure brain activity (Breedlove & Watson, 2020).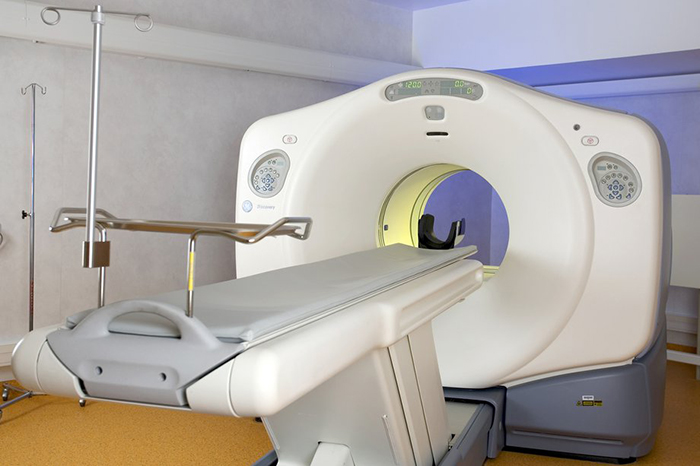
PET scans achieve low temporal resolution (seconds to minutes) with moderate spatial resolution. PET images © Yok_onepiece/Shutterstock.com are shown below.
Single-Photon Emission Computerized Tomography
Single-photon emission computerized tomography (SPECT) is a functional imaging technique that uses gamma rays to create three-dimensional, and slice images of cerebral blood flow averaged over several minutes. Graphic © rumruay/Shutterstock.com.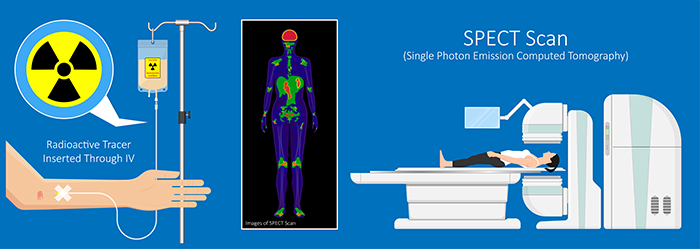
SPECT achieves limited temporal (minutes) and spatial resolution (centimeters).
Using a Limited Number of Electrodes
Peer-reviewed evidence suggests that more EEG channels provide a more accurate assessment and achieve superior clinical or performance outcomes compared with fewer channels (Lau et al., 2012).
Although some practitioners conduct assessment and training with a single channel, assessments and training methods that use more than one channel have become more available. For example, the cost of a full 19-channel EEG assessment has decreased substantially. Such an assessment can provide not only EEG amplitude data from all sites in the 10-20 system but additionally makes calculations of metrics such as coherence and phase that give information on how well the 10-20 sites communicate with each other. These data from multi-channel methods are beneficial for complex symptom profiles like those associated with Autism Spectrum Disorders, epilepsy, and traumatic brain injury (Thompson & Thompson, 2016). Graphic © Chaikom/Shutterstock.com.
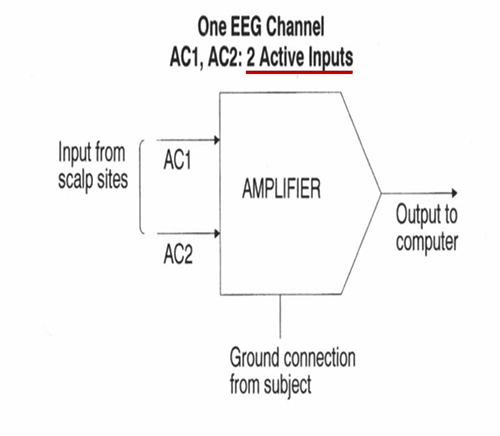
A channel is an EEG amplifier output that is the result of scalp electrical activity from three electrode/sensor connections to the scalp. These sensors are commonly known as active, reference, and ground electrodes, though they are more appropriately called positive +, negative - and reference. They are placed on the head in the following manner: an active or positive electrode is placed over a known EEG generator like Cz. A reference or negative electrode may be located on the scalp, earlobe, or mastoid. A ground/reference electrode may also be placed on an earlobe or mastoid (Thompson & Thompson, 2016).
Active and reference sensors are identical balanced inputs and interchangeable. However, some neurofeedback data acquisition systems require the designation of a specific sensor as a "reference," as in a linked-ears reference.
A derivation is the assignment of two electrodes to an amplifier's inputs 1 and 2. For example, Fp1 to O2 means that Fp1 is placed in input 1 and O2 in input 2.
A montage groups electrodes together (combines derivations) to record EEG activity (Thomas, 2007).
All montages compare EEG activity between one or more pairs of electrode sites.
Modern amplifiers record all input sensors in reference to a common sensor - often Cz - and all montage (sensor comparison) changes are performed in the software. Amplifiers no longer require manual switching of electrodes between inputs.The narrated video below © John S. Anderson displays the same 21-channel recording viewed using different montages with a 60-Hz notch filter on and off.
Montage Options and Their Consequences
Referential (Monopolar) Montage
A referential (monopolar) montage places one active electrode (A) on the scalp and a "neutral" reference (R) and ground (G) on the ear or mastoid. Graphic © John S. Anderson.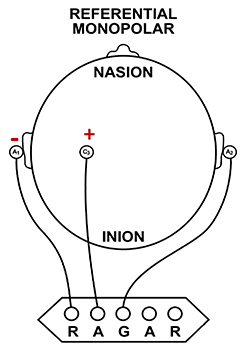
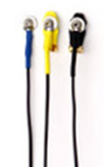
A referential montage assumes that the EEG activity seen on the computer screen represents the active (+) site because the reference (-) site is assumed to be neutral (i.e., producing no EEG activity) and because of the subtraction of signals produced by noise and artifacts that are common to both active and reference sites (common-mode rejection). In the photograph below, the blue cable would be used for the active electrode, the yellow cable with an ear clip for reference, and the black cable with an ear clip for the ground.
However, this montage is vulnerable to artifact from the contraction of facial muscles (Demos, 2019). The ear reference is also known to produce reference contamination, where EEG signals from this electrode are contributed or added to other electrodes via the mechanism of the differential amplifier, where anything different between the "active" and "reference" sensors is retained. This commonly results in alpha activity produced by posterior sources of alpha that are close to the ear.
Sequential (Bipolar) Montage
A sequential (bipolar) montage presents a sequence of comparisons of positive (+) and negative (-) electrodes (often called ‘active’ and ‘reference’) that are attached to sites on the scalp and therefore considers the reference electrode to be a second active electrode. The ground (G) electrode is attached to the scalp, to an earlobe, or over the mastoid process. Graphic © John S. Anderson.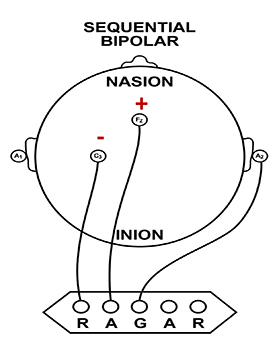
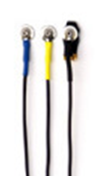
The sequential montage detects the difference in EEG between the positive and the negative electrodes (active and reference), as the referential montage does. Still, now the signal for the channel represents the difference between two sources of EEG activity. In cases when 19-channels are used, this montage is usually presented with electrode pairs shown in sequence. In the photograph below, note that only the black cable for the ground has an ear clip.
When used as only a single channel, this montage does not allow good detection of localized EEG activity because it shows only the difference between the A and R signals. However, when used as part of a 19-channel assessment, it localizes EEG events related to epilepsy. This montage can also reduce artifact when the A and R electrodes are relatively close together.
A sequential montage is frequently used in neurofeedback and trains the difference between EEG activity at the A and R electrodes. However, when neurofeedback training produces a change, it remains uncertain whether it is because of a change in EEG at the A electrode, the R electrode, or both electrodes.
The EEG record appears more similar when sensors are closer together and less similar when they are farther apart (Fp1-O2). When electrodes are spaced close together (Fp1-Fp2), this montage may reject actual EEG activity (Fp1-Fp1). Graphic © John S. Anderson.
Recognizing and Correcting Signals of Noncerebral Origin
EEG artifacts, which consist of noncerebral electrical activity, can be divided into physiological and exogenous artifacts. Physiological artifacts include electromyographic, electro-ocular (eye blink and eye movement), cardiac (pulse), sweat (skin impedance), drowsiness, and evoked potential. Exogenous artifacts include movement, 60 Hz and field effect, and electrode (impedance, bridging, and electrode pop) artifacts.
Electromyographic (EMG) Artifact
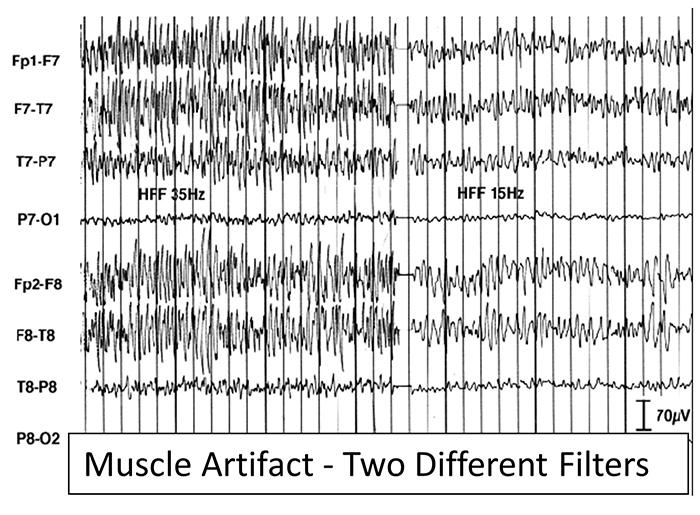
EMG artifact is interference in EEG recording by volume-conducted signals from skeletal muscles. This artifact contains high-frequency activity that resembles a "buzz" of fast activity during a contraction. EMG is seen as fast beta activity in the qEEG. While some frequencies are between 10-70 Hz, most are 70 Hz or higher.The graphic shows how high-frequency filter (HFF) selection can affect contamination by this artifact. A high-frequency filter (low-pass filter) attenuates frequencies above a cutoff frequency. In the examples below, the cutoffs are 35 Hz and 15 Hz.
All the channels on the left side of the tracing show SEMG artifact admitted by a 35-Hz high-frequency filter. The right tracing is free from SEMG artifact since its 15-Hz high-frequency filter attenuates the higher frequencies that contain this artifact.
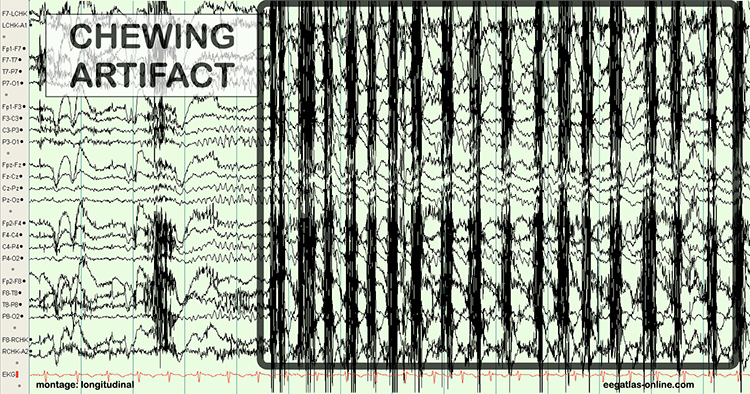
The next graphic shows how gum chewing can generate SEMG artifact by contracting the muscles of mastication. Graphics © eegatlas-online.com.
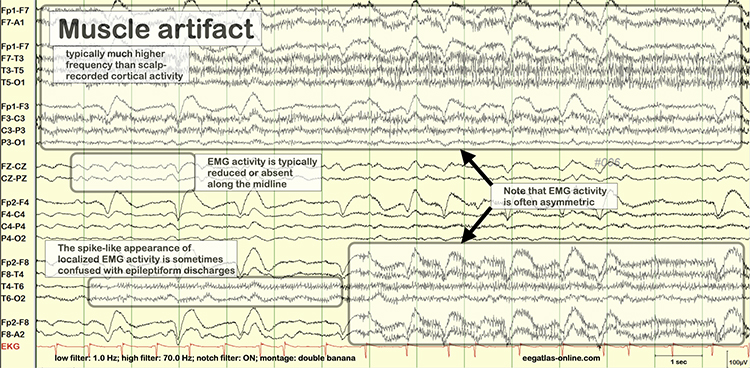
The frequency spectrum for SEMG artifact ranges from 2-1,000 Hz. While strong muscular contraction can contaminate all frequency bands, including 10 Hz, the beta rhythm (at 70 Hz or higher) is most affected by this artifact. EMG artifact may create the appearance of greater beta activity than is present. Graphic © eegatlas-online.com.
Below is a BioGraph ® Infiniti EMG artifact display. Note how the amplitude of the EEG spectrum increases with each contraction.
Thompson and Thompson (2016) observed that EMG artifact is readily detected because it affects one or two channels, particularly at T3 and T4 at the periphery, and less often at O1, O2, Fp1, and Fp2.
You can identify EMG artifact by visually inspecting the raw signal. The next graphic shows SEMG artifact using a 70-Hz high-frequency filter.
Electro-Ocular Artifact
Electro-ocular artifact contaminates EEG recordings with potentials generated by eye blinks, eye flutter, and other eye movements. For example, anxious patient eyelid flutter may cause deflections at Fp1 and Fp2 (Klass, 2008).This artifact is due to the movement of the eye’s electrical field when the eye rotates and the contraction of the extraocular muscles. The eye creates a dipole that is electropositive at the front and electronegative at the back. Bell’s Phenomenon refers to the upward rotation of the eye when it closes and causes an artifact seen as an apparent increase in EEG.
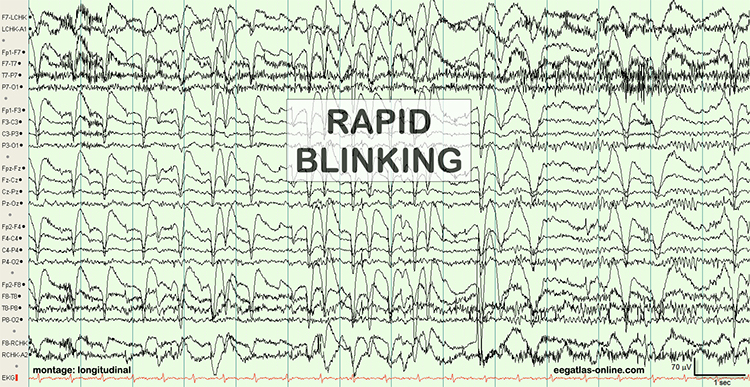
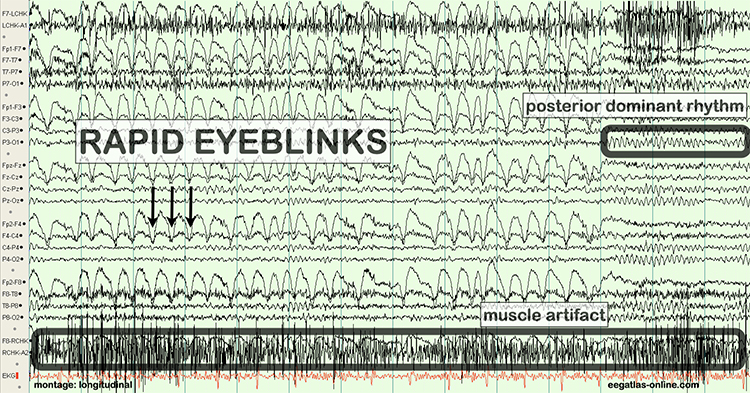
The next two graphics show eye movement artifact due to rapid blinking. Graphics © eegatlas-online.com.
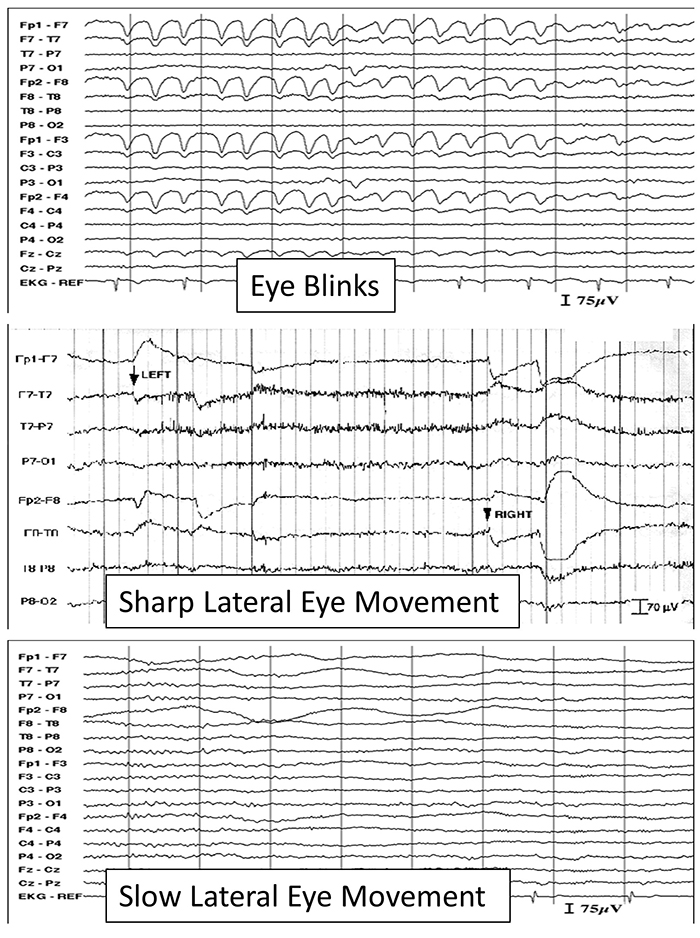
The next graphic shows eye blinks, sharp lateral eye movement, and slow lateral eye movement.
Below is a BioGraph ® Infiniti EEG display of eye movement artifact.
Below is a NeXus display of eye blink and EMG © John S. Anderson.
An upward eye movement will create a positive deflection at Fp1, while a downward eye movement may create a negative deflection. In a longitudinal sequential montage, the artifact is typically seen at frontal sites (Fp1- F3 and Fp2-F4). A left movement may produce a positive deflection at F7 and a negative deflection at F8 (Thompson & Thompson, 2015).
Rapid eye flutter may resemble seizure activity. Graphic © John S. Anderson.
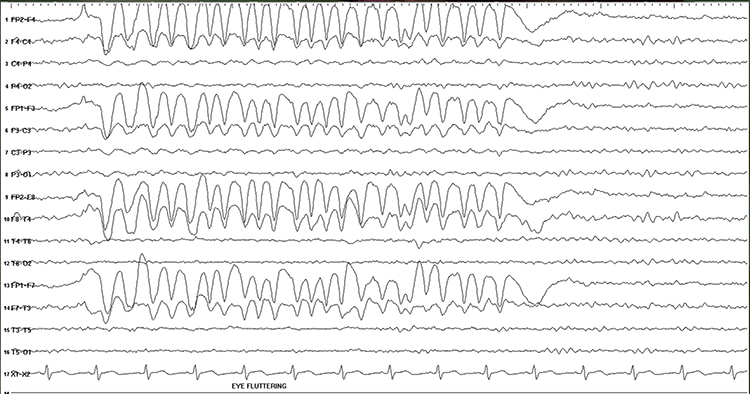
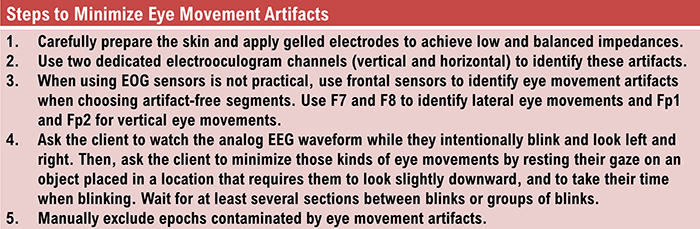
Cardiac and Pulse Artifacts
Cardiac artifact occurs when the ECG signal appears in the EEG. This artifact may be produced when electrode impedance is imbalanced or too high or when an ear electrode contacts the neck. The frequency range for ECG artifact is 0.05-80 Hz, and it contaminates the delta through beta bands. Since multiple electrodes detect this artifact, it can create the appearance of greater coherence than is present. Graphic © eegatlas-online.com.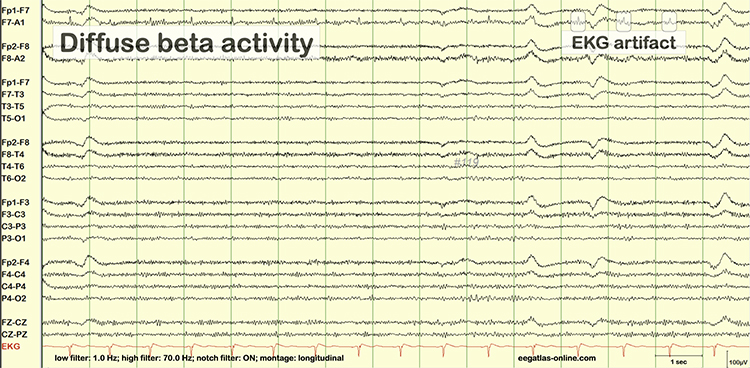
You can detect cardiac artifact by inspecting chart recorder, data acquisition, or oscilloscope displays of the raw EEG waveform. Cardiac artifact appears as a wave that repeats about once per second (Thompson & Thompson, 2016). Below is a BioGraph ® Infiniti ECG artifact display.
Pulse artifacts are due to the mechanical movement of an electrode in relation to the skin surface due to the pressure wave of each heartbeat. Graphic © eegatlas-online.com.
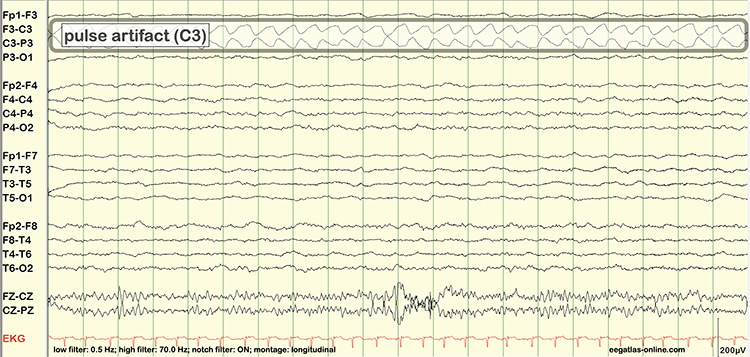
Sweat (Impedance) Artifact
Sweat artifact results from sweat on the skin changing the conductive properties under and near the electrode sites (i.e., bridging artifact). Sweating reduces electrode contact with the scalp and generates large-scale up and down EEG line movements in several frontal channels. This artifact is often elicited by abrupt, unexpected stimuli and usually appears as isolated 1-2 Hz slow waves of 1-2-s duration at frontal and temporal sites (Thompson & Thompson, 2015). Graphic © eegatlas-online.com.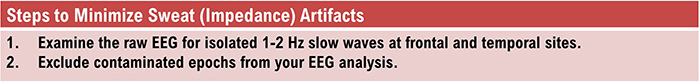
Bridging Artifact
A short circuit produces bridging artifact between adjacent electrodes due to excessive application of electrode paste or a client who is sweating excessively or who arrives with a wet scalp. Bridging artifact can cause adjacent electrodes to create a short circuit between adjacent electrodes that produces identical referential EEG recordings or a flat line with a bipolar montage. The Fp1-F3 channel's reduced amplitude and frequency illustrates bridging artifact.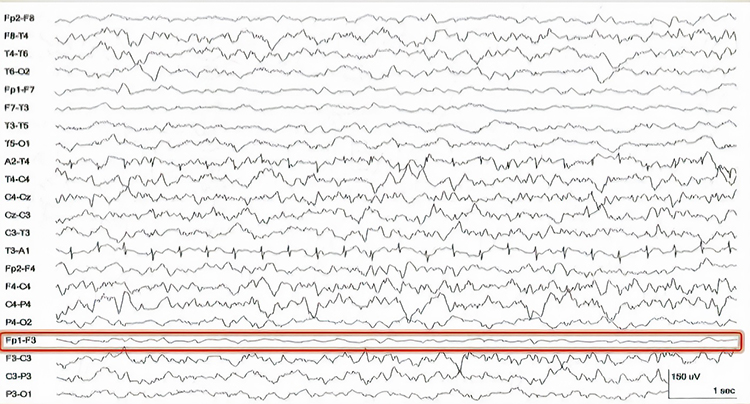
Drowsiness Artifact
Drowsiness artifact is the appearance of stage 1 or stage 2 sleep in the EEG. Stage 1 and stage 2 of sleep are most likely to occur during eyes-closed recording. Sleep may occur during eye-closed awake recording. Graphic © eegatlas-online.com.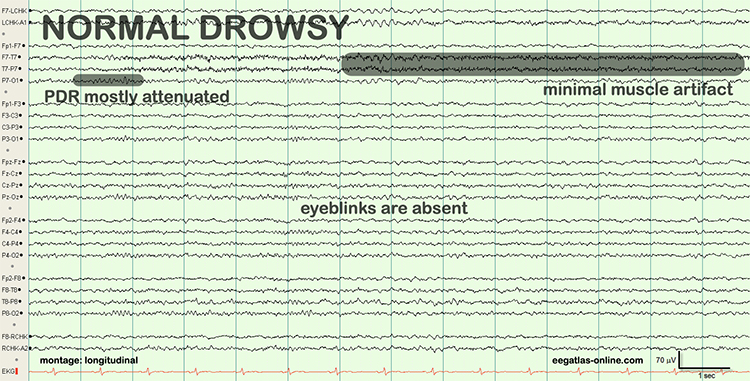
Stage 1 sleep is a subtle drowsy state of which clients are often not aware. Alpha amplitude (especially occipital) may decrease and theta (especially frontal) may increase. Slow eye-rolling movements will be accompanied by reductions in EMG and beta amplitude. Sleepiness may be accompanied by spike-like transients (vertex or V-waves). The graphic below © John S. Anderson shows increased theta during stage 1 sleep.
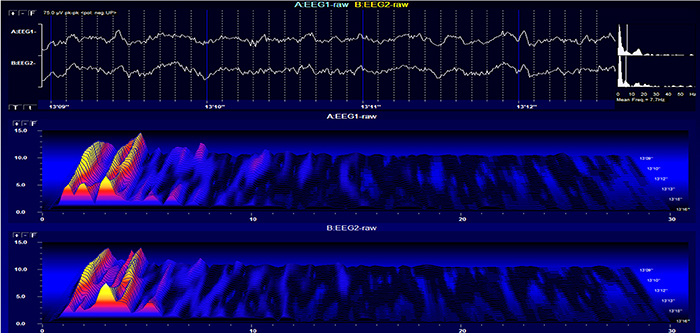
When you detect drowsiness artifact during a training session, suspend recording and instruct your clients to move their hands and legs to increase wakefulness. To avoid this artifact, ask them to retire early and sleep for 9 hours if possible (Thompson & Thompson, 2003).
Evoked Potential
Evoked potential artifact (also called event-related potential artifact) consists of somatosensory, auditory, and visual signal processing-related transients that may contaminate multiple channels of an EEG record. While evoked potentials increase recording variability and reduce its reliability, they minimally affect averaged data (Thompson & Thompson, 2015).The graphic below is courtesy of BPM biosignals' YouTube video EEG: Visually evoked potentials (VEP).
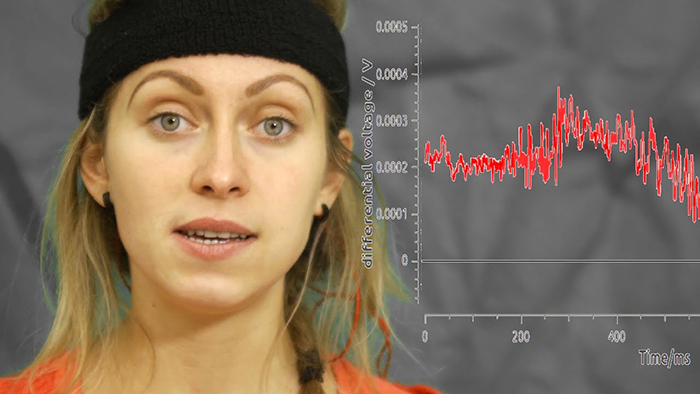
Movement Artifact
Movement artifact is caused by client movement or the movement of electrode wires by other individuals. Most of these artifacts are produced by brief changes in electrode-skin surface connection. Cable movement is called cable sway. The graphic below that illustrates cable sway is courtesy of iMotions.com.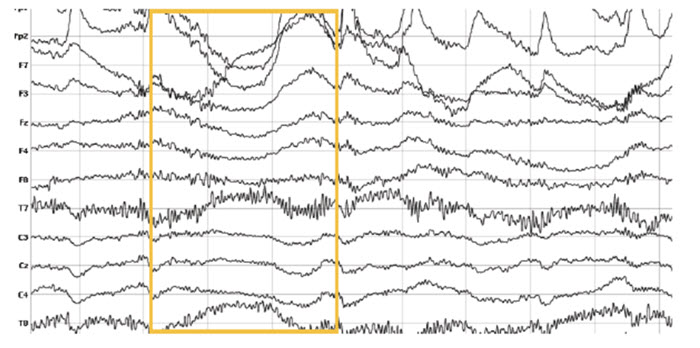
Movement artifact can produce high-frequency and high-amplitude voltages identical to EEG and EMG signals. While the delta rhythm is most affected by this artifact, it may also contaminate the theta band (Thompson & Thompson, 2016). Graphic © eegatlas-online.com.
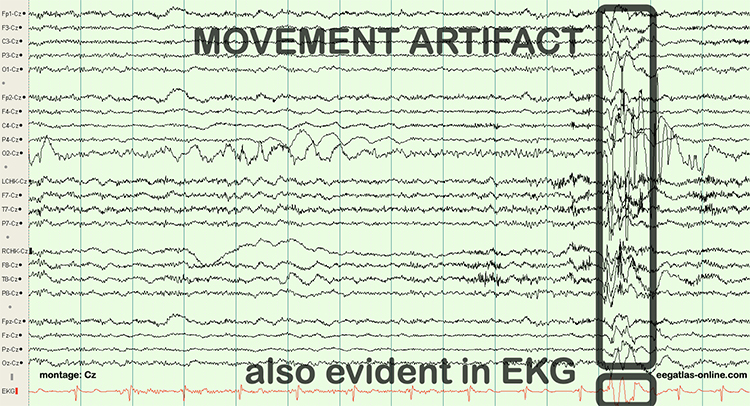
The graphic below shows movement artifact due to head movement (left), respiration (center), and tongue movement (right).
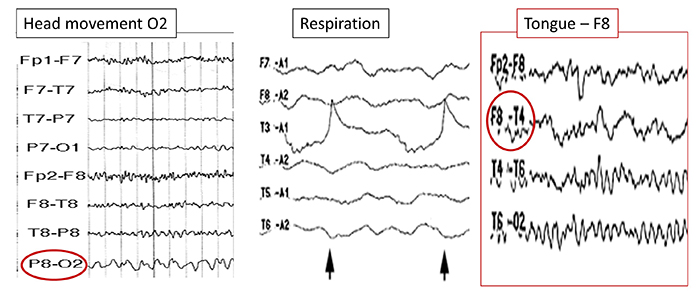
Below is a BioGraph ® Infiniti cable movement artifact display. Note the two voltage spikes at the beginning of the recording.
50/60 Hz and Field Artifacts
Both 50/60 Hz and field artifacts are external artifacts transmitted by nearby electrical sources. While 60-Hz artifact is a risk in North America where AC voltage is transmitted at 60 Hz, 50-Hz artifact is a problem in other locations that generate power at 50 Hz. Their fundamental frequency is 50 or 60 Hz with harmonics at 100/120 Hz, 150/180 Hz, and 200/240 Hz. Imbalanced electrode impedances increase an EEG amplifier's vulnerability to these artifacts. The 60-Hz artifact graphic below © John S. Anderson.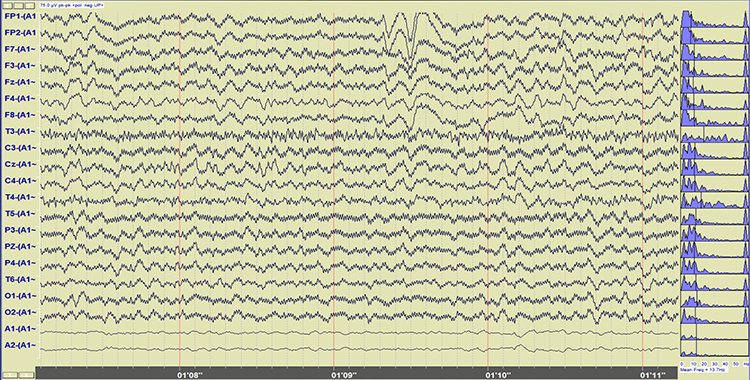
A BioGraph ® Infiniti display of 60-Hz artifact is shown below in red. Note the cyclical fluctuation in voltage and 60-Hz peak in the power spectral display.
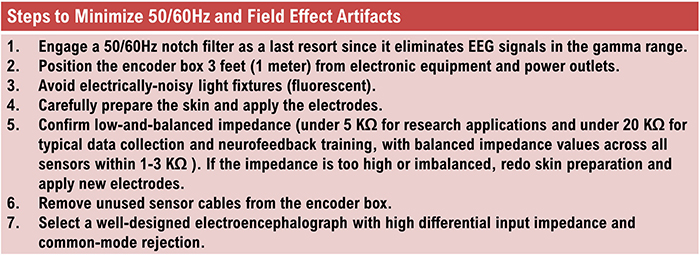
Radiofrequency Artifact
Radiofrequency (RF) artifact radiates outward like a cone from the front of televisions and computer monitors. Graphic © eegatlas-online.com.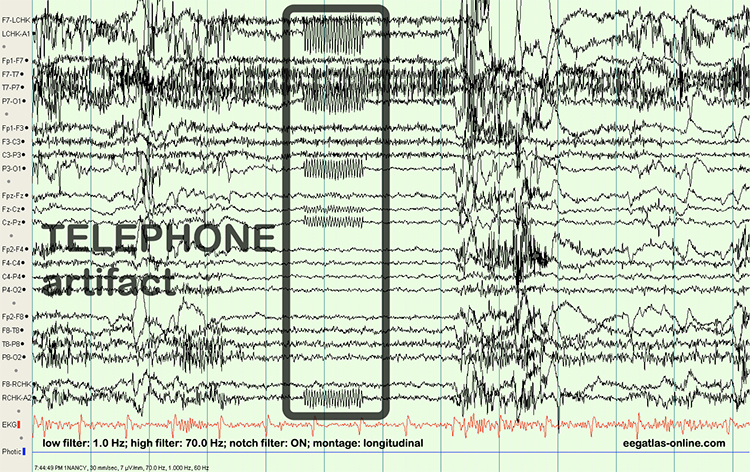
 Artifacts.jpg)
Electrode Artifacts
There are several sources of electrode artifacts. Even with proper care, electrode surfaces can become corroded and the leads and connectors damaged. The use of sensors with mismatched electrode metals can cause polarization of amplifier input stages.Impedance Artifact
Unless skin-electrode impedance is low (under 5 KΩ for research and 20 KΩ for training) and balanced (under 1-3 KΩ ), diverse artifacts like 50/60 Hz and movement can contaminate the EEG signal, as seen in the P3 and Pz electrodes. Graphic © eegatlas-online.com.Electrode Pop Artifact
Even when impedance is low and balanced, mechanical disturbance can produce a unique artifact. Electrode pop artifact has a sudden large deflection in at least one channel when an electrode abruptly detaches from the scalp. This may also happen when there is a bubble or other defect in the gel or paste, and a charge builds up and subsequently "jumps" across the gap, resulting in a large electrical discharge. Graphic © John S. Anderson.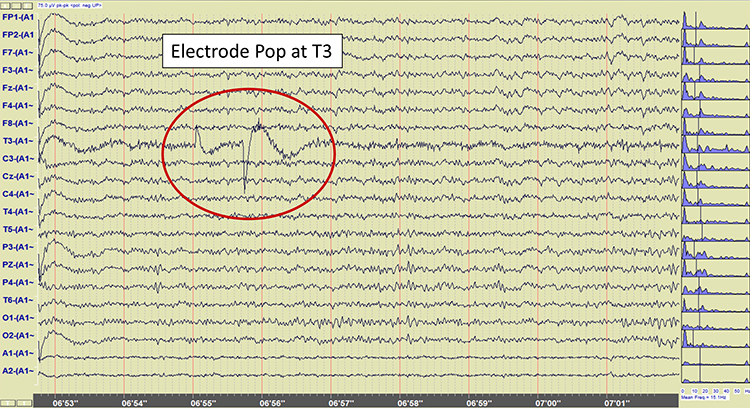
Recognizing Normal EEG Patterns
This section covers normal EEG patterns, including the posterior dominant rhythm, differences between eyes open and eyes-closed resting conditions, developmental aspects of the EEG, and diurnal influences on the EEG.
Normal EEG Patterns
The healthy adult EEG is a cerebral symphony comprised of theta, alpha, sensorimotor rhythm, beta, and gamma activity. We will survey the generators, distributions, and behavioral correlates of these rhythms. EEG rhythms correlate with patterns of behavior (level of attentiveness, sleeping, waking, seizures, and coma), occur in distinct frequency ranges, and are characterized by synchrony and desynchrony.Synchrony means that pools of neurons coordinate their firing due to pacemakers (top) and mutual coordination (bottom).
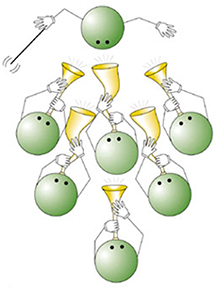
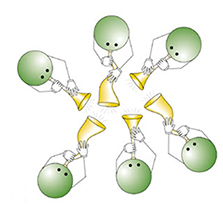
The synchronized EEG graphic below © John S. Anderson.
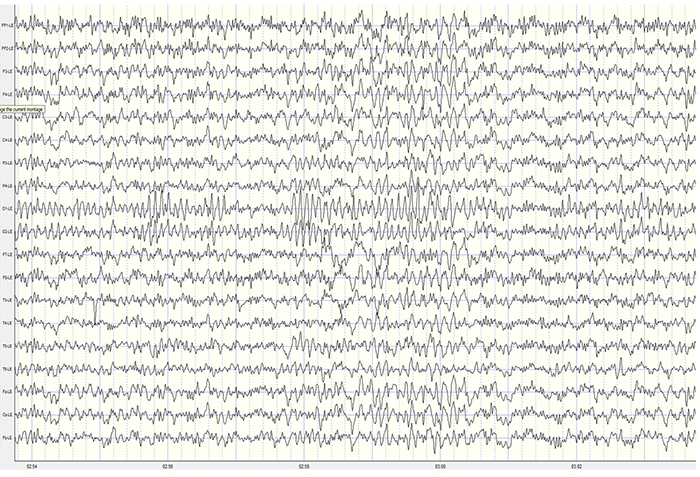
Desynchrony means that pools of neurons firing independently due to stimulation of specific sensory pathways up to the midbrain and high-frequency stimulation of the reticular formation and nonspecific thalamic projection nuclei.
The desynchronized EEG graphic below © John S. Anderson.
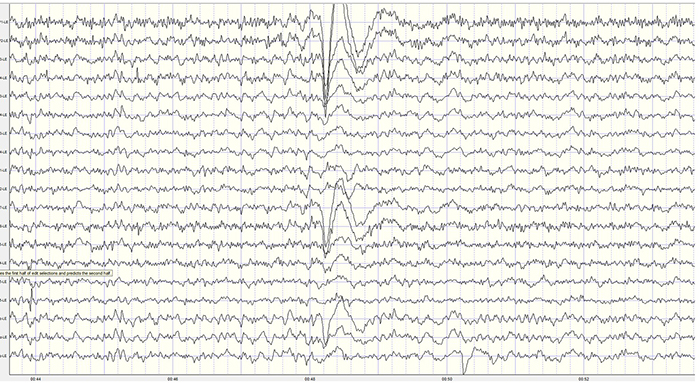
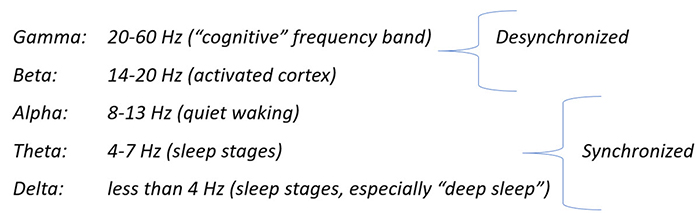
Graphic © John S. Anderson.
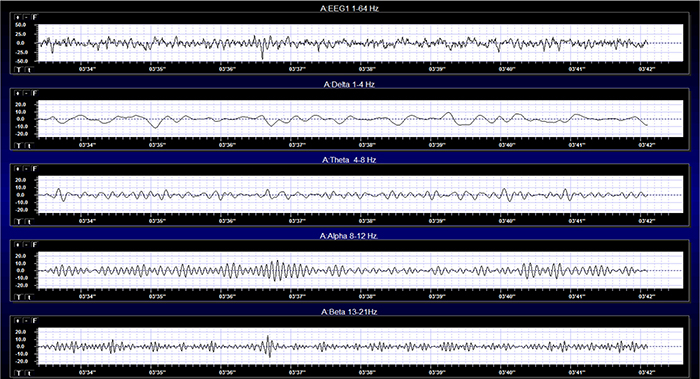
Effect of Eyes Open and Closed Conditions on the EEG
The alpha rhythm is strongly modulated by visual input. Opening the eyes blocks or reduces the occipital alpha rhythm. Hans Berger (1929) originally described this phenomenon. In contrast, eyes-closed alpha is associated with alert wakefulness and reduced visual input (Thompson & Thompson, 2016).The movie below is a 19-channel BioTrace+ /NeXus-32 display of eyes open and closed EEG © John S. Anderson. Note the appearance of alpha activity with eyes closed at about 14 seconds and alpha-blocking with eyes open at about 45 seconds.
The graphic below illustrates alpha-blocking and is courtesy of iMotions.
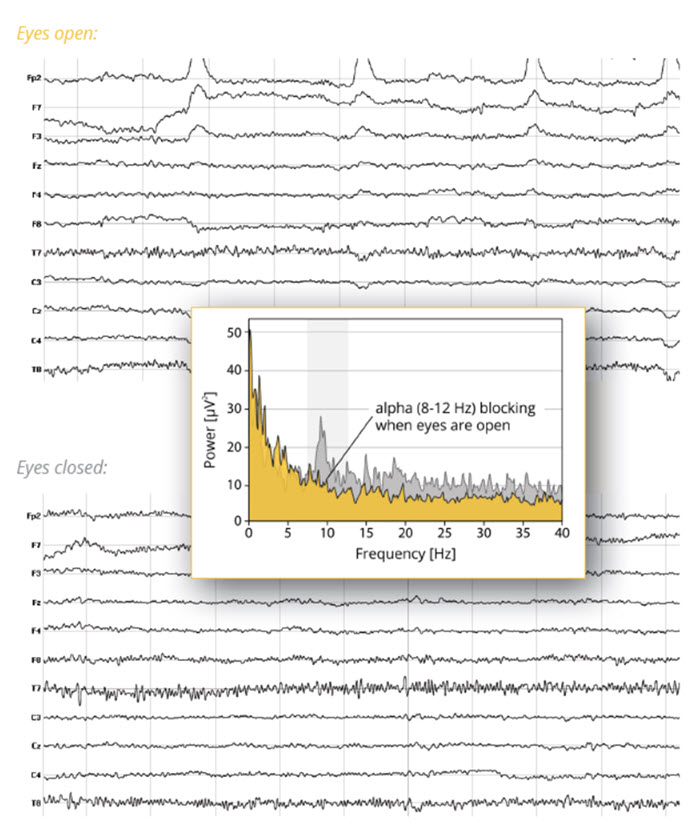
Posterior Dominant Rhythm
The posterior dominant rhythm (PDR) is the highest-amplitude frequency detected at the posterior scalp when eyes are closed. A healthy adult PDR is 10 Hz. Values below 9 Hz and above 11 Hz are abnormal, may result from psychoactive drugs, and may be associated with clinical symptoms like anxiety (Demos, 2019). Graphic © eegatlas-online.com. See the PDR at P3-O1. Developmental Aspects of EEG
Delta is dominant below age 3, theta from 3 to 5, and low alpha from 6 to 8. Alpha frequency increases to a peak around 10 Hz after age 10. Peak frequencies slow during adulthood with aging (Thompson & Thompson, 2016).The PDR rises with age: 1 year (6 Hz), 8 years (8 Hz), 10-12 years (9 Hz), and 13-14 years (10 Hz) (Demos, 2019).
Diurnal Influences on the EEG
Alpha and theta rhythm amplitudes vary across the day, with the highest values at 11 am, 1 pm, and 3 pm. Fatigue and individual differences (but not eating) influence the magnitude of change and precise peak times. Serial assessments should be conducted at the same time of day to control for diurnal fluctuations (Thompson & Thompson, 2015).Evaluation of Subject Variables During Acquisition
Subject variables are crucial to the interpretation of EEG measurements. In this section, we will examine the importance of alertness-drowsiness, physical relaxation, and anxiety. We covered the effects of eyes closed/eyes open in the previous section and medication effects in the Psychopharmacology unit.Alertness-Drowsiness
A client's age determines how drowsiness is expressed in the EEG. Between 6 months and 2 years (and rarely after 12 years), most children present with hypnogogic hypersynchrony (abrupt appearance of low-amplitude spikes that resemble epileptiform activity otherwise normal record). Beta activity between 20-25 Hz also maximally appears centrally and posteriorly. When older children and adults are drowsy or enter stage 1 and 2 sleep, frontocentral beta may be activated (Fisch, 1999).Adult EEG drowsiness patterns increasingly appear by age 10. Slow lateral eye movements are associated with 1-Hz (or slower) waveforms that can be detected with greatest amplitude and reverse polarity at F7 and F8. Continued drowsiness may be related to 1-2 Hz slowing of the alpha rhythm. For this reason, it is crucial to confirm client wakefulness when assessing alpha rhythm frequency (Fisch, 1999. Graphic © fizkes/Shutterstock.com.

From age 10 and 20, drowsiness is often accompanied by rhythmic frontal theta (Fisch, 1999).
Physical Relaxation
The human stress response is multidimensional and involves diverse systems, ranging from the central nervous system to the immune system. Each person uniquely responds to stressors. This is called response stereotypy.Individuals differ in which systems are involved, the degree of their activation or suppression, and the impact of these changes on their health.
Since clients show widely different response stereotypies, assessment should monitor multiple physiological channels, including blood volume pulse (BVP) for heart rate and heart rate variability, electromyography (EMG), a respirometer for respiration rate and pattern, skin conductance (SC), and skin temperature.
A capnometer, which measures end-tidal CO2, can complement the information provided by a respirometer by detecting CO2 reductions due to overbreathing, which is more subtle than hyperventilation (Khazan, 2019).
Professionals can find the normative values for these measures in Moss and Shaffer's (2019) Physiological Recording Technology in Biofeedback and Neurofeedback.
Stress responses that affect physiologic responses outside the CNS can cause artifacts in EEG recordings. Therefore, when client distress produces excessive artifact, a professional may have to coach the client to relax guided by one or more biofeedback modalities.
Clients should be monitored in a comfortable but upright position.

Anxiety
Clients who are anxious often present with decreased alpha and increased 19-21 Hz or 20-23 Hz beta activity. Conversely, anxious adults diagnosed with ADHD may show increased alpha activity. Even without perceptible sweating, anxious patients may present with intermittent biphasic slow-wave activity (Picton & Hillyard, 1972). Graphic © Peshkova/Shutterstock.com.

Clients who experience panic may exhibit paroxysmal EEG activity (Thompson & Thompson, 2015).
Glossary
50/60 Hz: external artifacts transmitted by nearby electrical sources.
active electrode: an electrode that is placed over a site that is a known EEG generator like Cz.
alpha-blocking: the replacement of the alpha rhythm by low-amplitude desynchronized beta activity during movement, attention, mental effort like complex problem-solving, and visual processing.
amplitude: the strength of the EEG signal measured in microvolt or picowatts.
artifact: false signals like 50/60Hz noise produced by line current.
asynchronous waves: neurons depolarize and hyperpolarize independently.
bridging artifact: short circuit between adjacent electrodes due to excessive application of electrode paste or a client who is sweating excessively or who arrives with a wet scalp.
cardiac artifact: contamination of the EEG by the ECG signal.
channel: EEG amplifier output that is the result of scalp electrical activity from three electrode/sensor connections to the scalp.
computerized axial tomography (CAT or CT): the creation of medium-resolution images of brain structure by moving an x-ray source along an arc surrounding the head.
derivation: the assignment of two electrodes to an amplifier's inputs 1 and 2.
desynchrony: pools of neurons fire independently due to stimulation of specific sensory pathways up to the midbrain and high-frequency stimulation of the reticular formation and nonspecific thalamic projection nuclei.
differential amplifier (balanced amplifier): device that boosts the difference between two inputs: the active (input 1) and reference (input 2).
drowsiness artifact: in adults, 1-Hz (or slower) waveforms can be detected with greatest amplitude and reverse polarity at F7 and F8 may progress to 1-2 Hz slowing of the alpha rhythm.
EEG artifacts: noncerebral electrical activity in an EEG recording can be divided into physiological and exogenous artifacts.
electro-ocular artifact: contamination of EEG recordings by potentials generated by eye blinks, eye flutter, and eye movements.
electrode: specialized conductor that converts biological signals like the EEG into currents of electrons.
electrode pop artifact: sudden large deflections in at least one channel when an electrode abruptly detaches from the scalp.
EMG artifact: interference in EEG recording by volume-conducted signals from skeletal muscles.
evoked potential artifact (event-related potential artifact): somatosensory, auditory, and visual signal processing-related transients that may contaminate multiple channels of an EEG record.
exogenous artifacts: noncerebral electrical activity generated by movement, 50/60 Hz and field effect, bridging, and electrode (electrode “pop" and impedance) artifacts.
field artifacts: external artifacts transmitted by nearby electrical sources.
frequency (Hz): the number of complete cycles that an AC signal completes in a second, usually expressed in hertz.
functional magnetic resonance imaging (fMRI): an imaging technique to detect brain regions' oxygen use during specific tasks indirectly.
ground electrode: sensor placed on an earlobe, mastoid bone, or the scalp that is grounded to the amplifier.
hertz (Hz): unit of frequency measured in cycles per second.
high-frequency filter (HFF): a filter that attenuates frequencies above a cutoff frequency.
hypnogogic hypersynchrony: the abrupt appearance of low-amplitude spikes that resembles epileptiform activity in an otherwise normal record.
impedance (Z): complex opposition to an AC signal measured in Kohms.
impedance meter: device that uses an AC signal to measures impedance in an electric circuit, such as between active and reference electrodes.
impedance test: automated or manual measurement of skin-electrode impedance.
inion: bony prominence on the back of the skull.
International 10-10 system: a modified combinatorial system for electrode placement that expands the 10-20 system to 75 electrode sites to increase EEG spatial resolution and improve detection of localized evoked potentials.
International 10-20 system: standardized procedure for the placement of 21 recording and one ground electrode on adults.
magnetoencephalography (MEG): a noninvasive functional imaging technique that uses SQUIDs (superconducting quantum interference devices) to detect the weak magnetic fields generated by neuronal activity.
magnetic resonance imaging (MRI): a noninvasive imaging technique that uses strong magnetic fields and bursts of RF energy to construct highly detailed images of the living brain.
mastoid bone: bony prominence behind the ear.
microvolt (μV): unit of amplitude (signal strength) that is one-millionth of a volt.
monopolar recording: recording method that uses one active and one reference electrode.
montage: a grouping of electrodes (combining derivations) to record EEG activity.
motor unit: an alpha motor neuron and the skeletal muscle fibers it innervates.
movement artifact: voltages caused by client movement or the movement of electrode wires by other individuals.
nasion: depression at the bridge of the nose.
notch filter: a filter that suppresses a narrow band of frequencies, such as those produce by line current at 50/60Hz.
ohm (Ω): unit of impedance or resistance.
physiological artifacts: noncerebral electrical activity that includes electromyographic, electro-ocular (eye blink and eye movement), cardiac (pulse), sweat (skin impedance), drowsiness, and evoked potential.
polarization: chemical reactions produce separate regions of positive and negative charge where an electrode and electrolyte make contact, reducing ion exchange.
positron emission tomography (PET): a functional imaging technique that injects radioactive chemicals into the brain's circulation to measure brain activity.
posterior dominant rhythm (PDR): highest-amplitude frequency detected at the posterior scalp when eyes are closed.
preauricular point: slight depression located in front of the ear and above the earlobe.
pulse artifacts: noncerebral voltages due to mechanical movement of an electrode in relation to the skin surface due to the pressure wave of each heartbeat.
Quantitative EEG (qEEG): digitized statistical brain mapping using at least a 19-channel montage to measure EEG amplitude within specific frequency bins.
reference electrode: electrode that is placed on the scalp, earlobe, or mastoid.
referential (monopolar) montage: placement of one active electrode (A) on the scalp and a neutral reference (R) and ground (G) on the ear or mastoid.
response stereotypy: a person’s unique response pattern to stressors of identical intensity.
sequential (bipolar) montage: placement of active (A) and reference (R) sensors on active scalp sites and the ground (G) to an earlobe or mastoid.
single photon emission computerized tomography (SPECT): a functional imaging technique that uses gamma rays to create three-dimensional and slice images of cerebral blood flow averaged over several minutes.
sweat artifact: changes in the EEG signal when sweat on the skin changes the conductive properties under and near the electrode sites (i.e., bridging artifact).
synchrony: the coordinated firing of pools of neurons due to pacemakers and mutual coordination.
tragus: flap at the opening of the ear.
vertex (Cz): the intersection of imaginary lines drawn from the nasion to inion and between the two preauricular points in the International 10-10 and 10-20 systems.
REVIEW FLASHCARDS ON QUIZLET
Click on the Quizlet logo to review our chapter flashcards.
Assignment
Now that you have completed this module, explain why low-and-balanced skin-electrode impedances are important in neurofeedback training. Describe the precautions you take to achieve acceptable impedance values. How do you measure impedance with your neurofeedback system?
References
Andreassi, J. L. (2000). Psychophysiology: Human behavior and physiological response. Lawrence Erlbaum and Associates, Inc.
Basmajian, J. V. (Ed.). (1989). Biofeedback: Principles and practice for clinicians. Williams & Wilkins.
Breedlove, S. M., & Watson, N. V. (2020). Behavioral neuroscience (9th ed.). Sinauer Associates, Inc.
Cacioppo, J. T., & Tassinary, L. G. (Eds.). (1990). Principles of psychophysiology. Cambridge University Press.
Collura, T. F. (2014). Technical foundations of neurofeedback. Taylor & Francis.
Demos, J. N. (2019). Getting started with neurofeedback (2nd ed.). W. W. Norton & Company.
Fisch, B. J. (1999). Fisch and Spehlmann's EEG primer (3rd ed.). Elsevier.
Floyd, T. L. (1987). Electronics fundamentals: Circuits, devices, and applications. Columbus: Merrill Publishing Company.
Grant, A. (2015). Four elements earn permanent seats on the periodic table. Science News.
Halford, J. J., Sabau, D., Drislane, F. W., Tsuchida, T. N., & Sinha, S. R. (2016). American Clinical Society Guideline 4: Recording clinical EEG on digital media. Journal of Clinical Neurophysiology, 33(4), 317-319.
Hugdahl, K. (1995). Psychophysiology: The mind-body perspective. Harvard University Press.
Hughes, J. R. (1994). EEG in clinical practice (2nd ed.). Butterworth-Heinemann.
Khazan, I. Z. (2019). Biofeedback and mindfulness in everyday life: Practical solutions for improving your health and performance. W. W. Norton & Company.
Klass, D. W. (2008). The continuing challenge of artifacts in the EEG. EEG artifacts. American Society of Electroneurodiagnostic Technologists, Inc.
Kubala, T. (2009). Electricity 1: Devices, circuits, and materials (9th ed.). Cengage Learning.
Lau, T. M., Gwin, J. T., & Ferris, D. P. (2012). How many electrodes are really needed for EEG-based mobile brain imaging? Journal of Behavioral and Brain Science, 2(3), 387-393. doi:10.4236/jbbs.2012.23044
Lebby, P. C. (2013). Brain imaging: A guide for clinicians. Oxford University Press.
Libenson, M. H. (2010). Practical approach to electroencephalography. Saunders Elsevier.
Lin, F., Witzel, T., Hamalainen, M. S., Dale, A. M., Belliveau, J. W., & Stufflebeam, S. M. (2004). Spectral spatiotemporal imaging of cortical oscillations and interactions in the human brain. NeuroImage, 2(3), 582-595.
Montgomery, D. (2004). Introduction to biofeedback. Module 3: Psychophysiological recording. Association for Applied Psychophysiology and Biofeedback.
Nilsson, J. W., & Riedel, S. A. (2008). Electric circuits (8th ed.). Pearson Prentice-Hall.
Peek, C. J. (2016). A primer of traditional biofeedback instrumentation. In M. S. Schwartz, & F. Andrasik (Eds.). (2016). Biofeedback: A practitioner's guide (4th ed.). The Guilford Press.
Picton, T. W., & Hillyard, S. A. (1972). Cephalic skin potentials in electroencephalography. Encephalogr Clin Neurophysiol, 33, 419-424.
Pfister, H., Kaynig, V., Botha, C. P., Bruckner, S., Dercksen, V., & Hege, H.-C. (2012). Visualization in connectomics. Mathematics and Visualization, 37. doi:10.1007/978-1-4471-6497-5_21
Stern, R. M., Ray, W. J., & Quigley, K. S. (2001). Psychophysiological recording (2nd ed.). Oxford University Press.
Thomas, C. (2007). What is a montage? EEG instrumentation. American Society of Electroneurodiagnostic Technologists, Inc.
Thompson, M., & Thompson, L. (2015). The biofeedback book: An introduction to basic concepts in applied psychophysiology (2nd ed.). Association for Applied Psychophysiology and Biofeedback.
C. SIGNAL PROCESSING
EEG waveforms may be described by their frequency, shape, and amplitude. The amount of energy within an EEG frequency band may be quantified using peak-to-peak and root mean square methods. Data acquisition systems transform the raw analog signal into a digital form. High sampling resolutions measured in digital bits are required to accurately sample DC and AC components and a wide range of signal voltages. A minimum sampling rate of twice the highest frequency is necessary when performing Fast Fourier Transform analysis. After the EEG signal has passed through several amplification stages, it is filtered to exclude unwanted frequencies and minimize artifact and distortion.
The EEG spectrum is composed of frequency bands which are further subdivided. EEG frequency bands are correlated with unique subjective states like internal focus and conscious problem-solving. Clinicians and researchers use LORETA, sLORETA, eLORETA, and surface Laplacian analysis to localize the cortical source of the scalp EEG.
Finally, professionals need to recognize and understand the significance of clinically significant raw waveforms like the kappa rhythm, lambda waves, vertex sharp transients, mu waves, spike and wave, SMR, sleep spindles, and K-complexes. The graphic below © engagestock/Shutterstock.com.
This unit covers Analog, Raw EEG, Basic Signal Measurement Terms, Filtering Methods, Subjective Characteristics of Frequency Bands, Waveform Morphology, Source Localization, and Clinically Significant Waveforms.
ANALOG, RAW EEG
EEG activity ranges from DC (slow cortical potentials) to gamma (34-60+ Hz) (Collura, 2014). Hertz (Hz) is an abbreviation for cycles per second. The raw EEG signal consists of oscillating electrical potential differences detected from the scalp. Raw or wave displays plot voltage using a bipolar (positive/negative) scale with zero in the middle. This is the analog form of the signal in which voltage continuously varies instead of digital representation using 0s and 1s. The graphic © John S. Anderson shows the voltage as µV peak to peak.
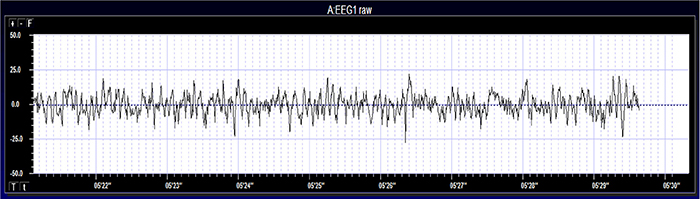
BASIC SIGNAL MEASUREMENT TERMS
EEG waveforms share the features of frequency and shape (Libenson, 2010). Frequency measures the speed and is the number of cycles completed each second. The higher the frequency (f), the shorter the wavelength (λ). The mathematical relationship is f = 1/λ. To measure frequency in the raw waveform, count the number of peaks or zero crossings and divide by 2. Graphic © John S. Anderson.
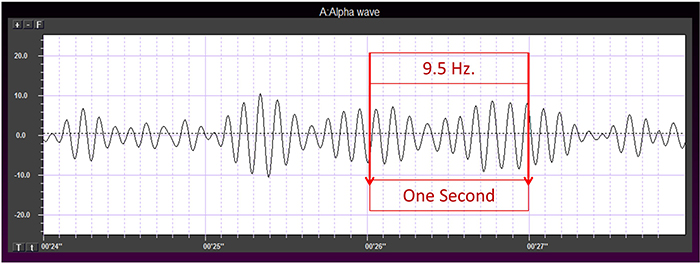
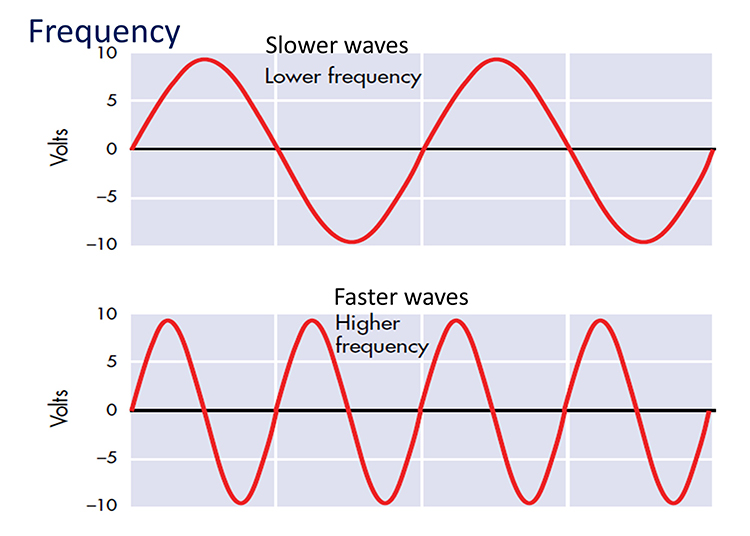
Amplitude measures size, which is the "amount" of energy within an EEG frequency band. The amplitude and morphology of any EEG frequency band reflect the number of neurons discharging simultaneously at that frequency. High amplitude means that many neurons are depolarizing and hyperpolarizing at the same time.
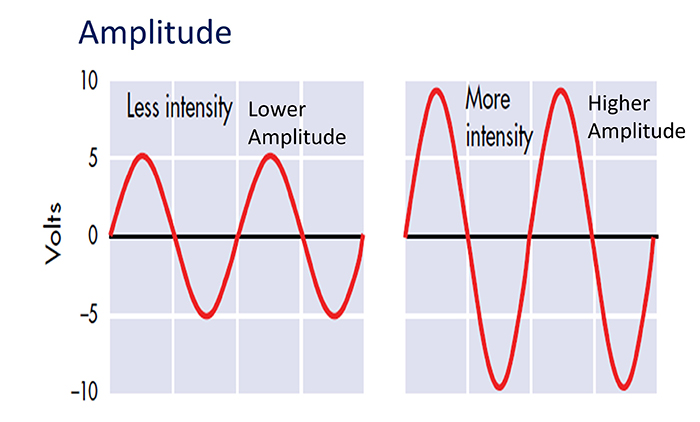
Greater synchrony among neurons firing results in higher amplitude (Demos, 2019). Graphic © John S. Anderson.
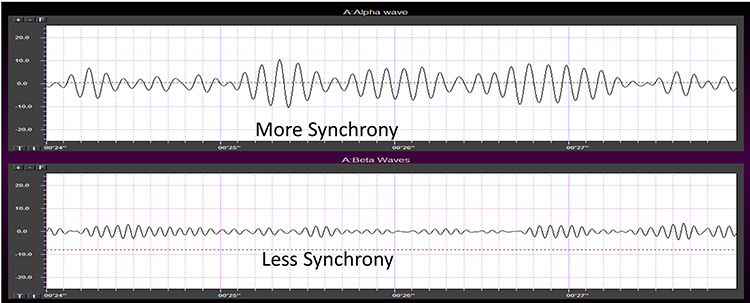
Amplitude displays show voltage using a scale where all values are positive (greater than zero). They only show voltage changes, not the signal waveform. Graphic © John S. Anderson shows the oscillating raw alpha waveform (top) and alpha amplitude (bottom).
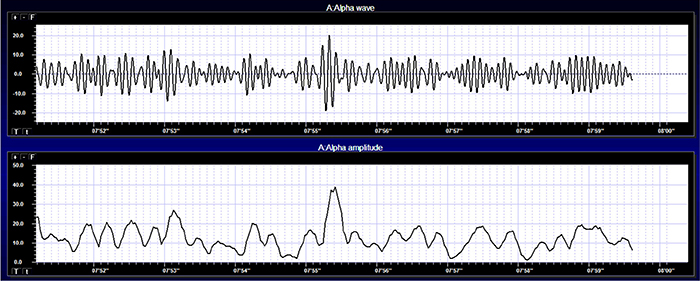
Magnitude represents the average amplitude over a unit of time using quantification methods like peak-to-peak (P-P) and root mean square (RMS). The peak-to-peak method measures waveform "height" from peak to trough. In contrast, the root mean square method calculates the area under the EEG waveform and is analogous to the weight of an object (Collura, 2014). The graphic below that illustrates EEG spectrum magnitude © John S. Anderson.
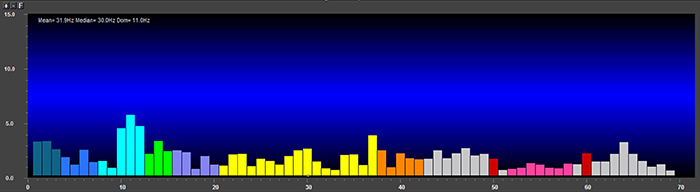
EEG signal power is magnitude squared and may be expressed as microvolts squared or picowatts/resistance. Most qEEG databases convert power into standard deviations, whereas the Jewel database transforms amplitudes into standard deviations or Z-scores (Demos, 2019). The graphic below © John S. Anderson shows the EEG power spectrum instead of the magnitude spectrum.
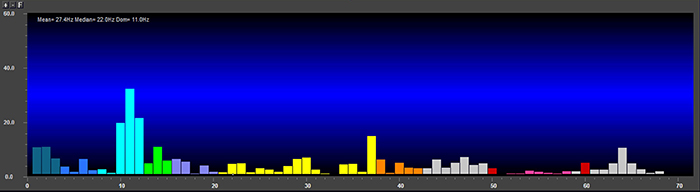
Percent power is the power within a frequency band expressed as a percentage of total EEG power. The graphic below © John S. Anderson shows alpha amplitude, alpha power, and alpha percent power.
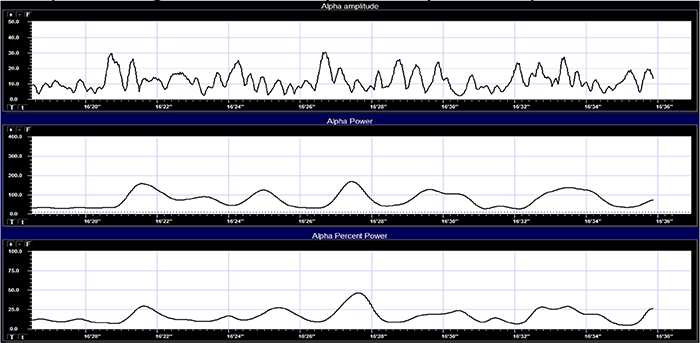
EEG waveforms may assume a distinctive shape or morphology like POSTs (positive occipital sharp transients of sleep), spindles (oscillations), and vertex (V) waves that appear over Cz during stage 2 sleep. The graphic below © eegatlas-online.com shows stage 2 sleep.
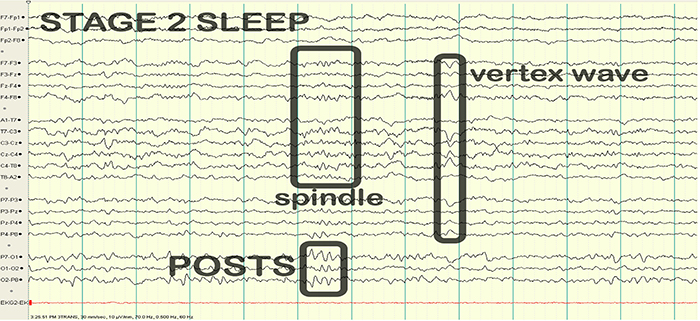
FILTERING METHODS AND SUBJECTIVE CHARACTERISTICS OF FREQUENCY BANDS
Sampling
Data acquisition systems digitize and process the raw EEG signal. Digitization transforms the raw signal into a digital form. An analog-to-digital converter (ADC) samples the analog signal (transforms it into numerical values) with a sampling resolution, sampling rate, and epoch length.The sampling resolution is the number of digital bits used to represent a signal. Each bit (binary digit) is assigned a binary value of 0 or 1. Systems that sample the EEG signal utilize from 8-24 bits. The advantages of 24-bit sampling are an accurate sampling of the EEG signal's DC and AC components and the ability to sample a wide range of signal voltages called the dynamic range (Collura, 2014). Graphic © John S. Anderson.
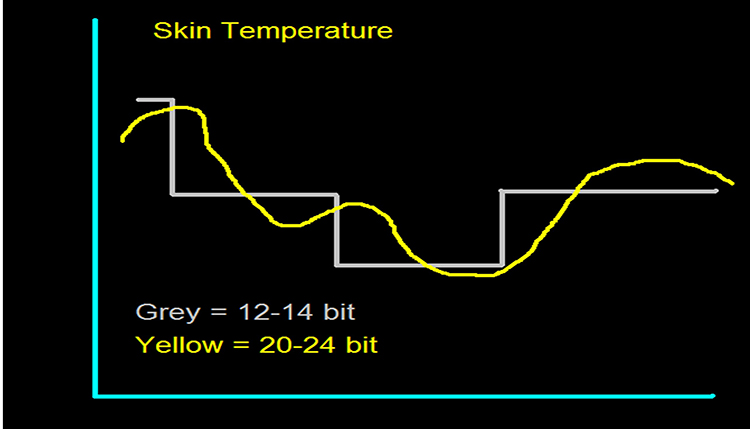
The sampling rate is the number of times that the ADC samples the EEG signal per second. A rate of twice the highest frequency is the minimum acceptable sampling rate when performing Fast Fourier Transform (FFT) analysis. Graphic © John S. Anderson.
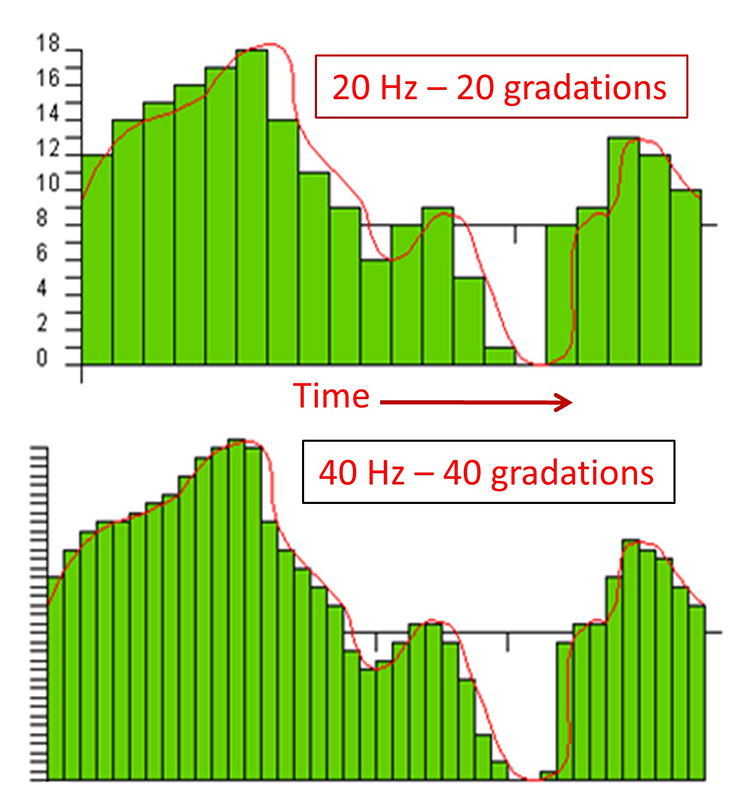
A FFT is a mathematical transformation that converts a complex signal into component sine waves whose amplitude can be calculated. The graphic below shows the decomposition of the original signal (left) into its sinewaves of different frequencies (center) and is courtesy of NTi Audio.
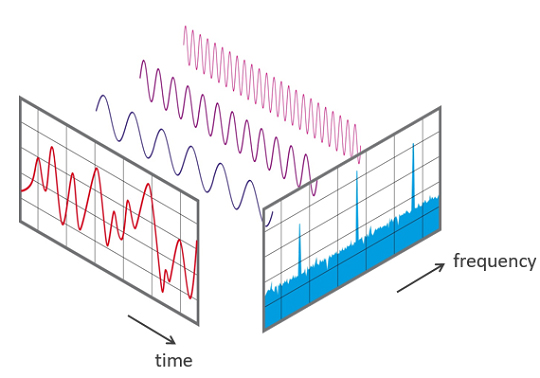
A rate of twice the highest frequency is insufficient to visually represent the EEG signal since it only samples the highest frequency twice per cycle. This low rate also allows the harmonics of 50/60 Hz noise (which can extend to several hundred hertz) to contaminate the EEG signal. For example, when there is a 240-Hz harmonic of 60Hz noise, sampling at 256 samples per second (sps) can result in a spurious 16-Hz waveform (Collura, 2014). Faster sampling rates are desirable, particularly when resolving high-frequency signals. A sampling rate of 512 sps is a good choice for frequencies up to 64 Hz, and 1024 sps is suitable for frequencies up to 128 Hz. However, a sampling rate of 256 sps is considered adequate for most purposes
FFT analysis breaks the EEG signal into 1- to 2-s chunks called epochs. Epoch length sets the lowest and highest frequencies that the FFT can represent (Collura, 2014). Graphic © John S. Anderson shows the conversion of a complex signal using FFT.
The FFT power spectral analysis video below © John S. Anderson. The top window shows the raw EEG signal, and the bottom window features a spectral display created using FFT analysis.
Joint time-frequency analysis (JTFA) computes values on each data point at rates up to 256 times per second without using a fixed epoch length. Where FFT simultaneously calculates amplitudes for all frequency bands, JTFA analyzes preselected bands. The JFTA graphic © John S. Anderson.
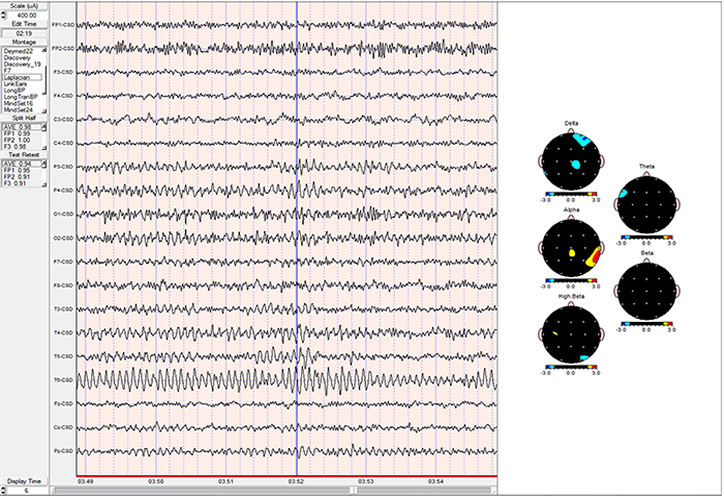
Filtering the Data
After a differential amplifier boosts the EEG signal, it is filtered and then amplified by a second single-ended amplifier. Filters exclude unwanted EEG frequencies to detect activity of clinical interest and minimize artifact and distortion. Filters exclude unwanted EEG frequencies to detect activity of clinical interest and minimize artifact and distortion. Clinical EEG analysis uses low-frequency, high-frequency, bandpass, and notch filters (Libenson, 2010). Clinicians must disable filters to examine EEG morphology (Demos, 2019).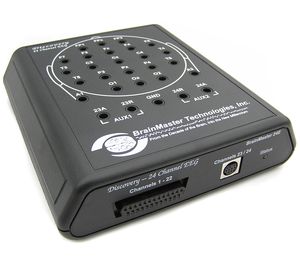
A low-frequency filter (high-pass filter) filters out low-frequency activity and passes only the frequencies above a set value (e.g., 1.6 Hz).
A high-frequency filter (low-pass filter) filters out high-frequency activity and passes only the frequencies lower than the set value (e.g.,15 Hz). This filter can help reduce the distortion that EMG artifact causes to the raw EEG waveform (Thompson & Thompson, 2015).
"However, use of filters to remove EMG artifact must be used with care because muscle artifact is broadband so that the remaining signal might well contain subtle but significant muscle artifact in roughly the 15-30 Hz range, where genuine EEG power is typically low. Such subtle artifact could substantially reduce signal-to-noise ratio in the beta band” (Nunez & Srinivasan, 2006).
A bandpass filter passes the frequencies between the set values, which constitute the "band" of the filter. The graphic © John S. Anderson.
A notch filter excludes a narrow frequency band to control 50/60Hz artifact produced by line current (Libenson, 2010). A 60-Hz notch filter attenuates adjacent frequencies (e.g., 58 Hz and 61 Hz). The 60-Hz notch filter graphic is courtesy of Wikipedia.
Analog and Digital Filters
Analog filters contain analog circuits designed using components like capacitors, resistors, and operational amplifiers. Analog filters represent voltage as continuously varying. Most analog filters use the infinite impulse response (IIR) approach, described below.Digital filters use digital processors, like a digital signal processing (DSP) chip, to exclude unwanted frequencies. First, an analog-to-digital converter (ADC) samples and digitizes the analog signal, representing signal voltages as binary numbers. Second, a DSP chip performs calculations on the binary numbers. Third, a digital-to-analog converter (DAC) may transform the sampled, digitally filtered signal back to analog form. Graphic © Foud A. Saad/Shutterstock.com.
Three main methods of digital filtering are finite impulse response (FIR), infinite impulse response (IIR), and Fast Fourier Transformation (FFT). Digital filters primarily sample data within a bandpass (e.g., 13-15 Hz) but do not wholly exclude frequencies above and below this frequency range. These frequencies are attenuated to varying degrees (Thompson & Thompson, 2015).
FIR filters continuously update their averaging of EEG voltage with new data points. A filter's order is determined by the number of data points that it averages. A higher-order filter more sharply attenuates frequencies outside the bandpass. Software may allow you to select both filter type and order. FIR filters attenuate frequencies above and below the bandpass more gradually than IIR and FFT filters.
Higher-order filters trade off precision for speed. The output of a higher-order filter provides a more accurate picture of the power in a specified band but does so more slowly than a lower-order filter. Recall that the order of a filter refers to the number of data samples used to calculate the output. A higher-order filter computes an output using more samples and is more accurate but introduces a longer delay, as each sample represents a period.
IIR filters assign frequency components to discrete bins as the signal is amplified. Demos (2019) likens these filters to a sieve that admits the signal of interest while discarding frequencies that won't be trained or measured. IIR filters are recursive because they use part of their output as input. IIR filters attenuate frequencies outside the bandpass more sharply than FIR filters with the same order, have greater time delay (that depends on frequency) due to greater filter sharpness, achieve faster computation due to their lower order, and are less stable than FIR filters.
FFT filters use Fast Fourier transforms to calculate the average voltage of an EEG signal's component frequencies for a specified time. This period must be at least as long as the most extended frequency period or wavelength. Therefore, to adequately represent 1 Hz (wavelength of 1000 ms) activity in the EEG using a FFT, at least 1 s of data must be used. This results in a too-slow response to provide the optimal representation of the data for real-time training - generally considered to be 250 ms or less. Because of this, FFTs are used for offline signal analysis and processing (qEEG) but not for either amplitude or z-score neurofeedback training.
Demos (2019) likens these filters to slicing a pie. FFT filters attenuate frequencies outside the bandpass more sharply than FIR filters and require greater computing power (Fisch, 1999; Thompson & Thompson, 2015).
Digital filtering methods enjoy four advantages over analog filters. First, clinicians can retrospectively adjust filter settings when reviewing the EEG record since digital filters are programmable. Second, digital filters can be designed to minimize phase distortion (displacement of the EEG waveform in time). Third, digital filters can achieve greater stability over time and across various frequencies. Fourth, digital filters can more accurately process low-frequency signals.
Since different digital filters can produce widely different statistics for the same frequency range, use the same filter for all statistical calculations (Thompson & Thompson, 2015).
Single-Hertz Bins
Neurofeedback providers using products like the Neuroguide LifeSpan database use single-hertz bins to determine the best training range for each client. They locate the highest amplitude bin (highest z-score) and select a range centered on that bin. Deviations from normal are correlated with clinically significant conditions. For example, lower than normal PDRs may index cognitive decline. For example, if the highest amplitude bin was 9 Hz, you could choose an 8-10 Hz training range. The wider the range, the less specific the training is to the highest amplitude bin (Demos, 2019).Single-hertz bins also help identify the posterior dominant rhythm (PDR), the highest amplitude frequency detected at the posterior scalp. The PDR is measured with eyes closed, and interpretation is based on age. Normal values are 6 Hz for 1-year-olds, 8 Hz for 8-year-olds, 9 Hz for 10-12-year-olds, and 10 Hz for 13-14 year-olds. For adults, normal values are between 9 and 11 Hz (Demos, 2019).
Subjective Characteristics of Frequency Bands
Most EEG power or signal energy falls within the 0-20 Hz frequency range. You may recall that hertz (Hz) is an abbreviation for cycles per second. The dominant frequency is the frequency with the greatest amplitude. It is at least 13 Hz in awake adults. EEG power is measured in microvolts or picowatts.
Higher frequencies reflect cognitive activity and active processing of sensory input. They involve relatively desynchronized activity like alert wakefulness and REM sleep. Lower frequencies reflect strongly synchronized activity like interactive neuronal communication, control of network activity, nondreaming sleep, and coma.
The table below is adapted from Wilson et al. (2011) and based on Thompson and Thompson (2015). Different authors define frequency bandpasses differently. For example, delta 0.5-3 Hz or 1-4 Hz.
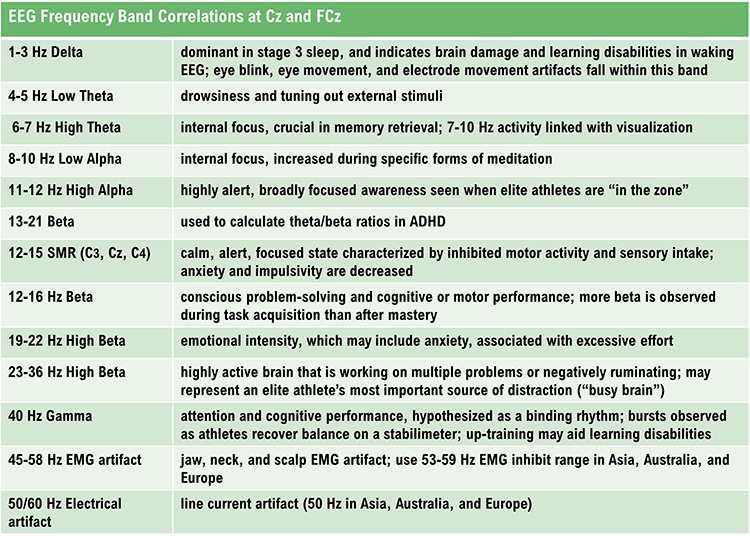
DELTA (0.05-3 HZ)
The delta rhythm ranges from 0.05-3 Hz with 20-200 microvolt synchronous waves. Microvolt means one-millionth of a volt. Synchronous means that groups of neurons depolarize and hyperpolarize at the same time. Graphic © John S. Anderson.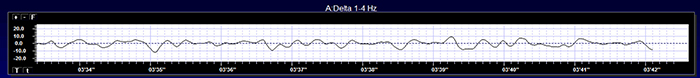
Delta comprises less than 5% of a healthy adult's percent of amplitude compared with 70% for occipital alpha (Thatcher, 1999). The greatest amplitude or signal strength is found in the central region of the scalp. The delta rhythm is the dominant frequency from ages 1-2 and is associated in adults with deep sleep and brain pathologies like trauma and tumors, and learning disability (Hugdahl, 1995; Thompson & Thompson, 2015).
Sleep deprivation can increase delta amplitude. Adult high-amplitude rhythmic delta indicates pathology like traumatic brain injury (TBI). Undergraduates performing problem-solving tasks exhibit arrhythmic delta (Lubar et al., 2001). Children diagnosed with ADHD or learning disabilities may present with diffuse delta and theta. When this occurs, clinicians may inhibit 2-7 Hz instead of 4-7 Hz. Amplitude training is appropriate for inhibiting but not rewarding delta (Demos, 2019).
Low-amplitude delta may be associated with ADHD, anxiety, insomnia, and TBI. Z-score training is safest for uptraining delta (Demos, 2019).
The movie below is a 19-channel BioTrace+ /NeXus-32 display of delta activity © John S. Anderson. Brighter colors represent higher delta amplitudes. Higher peaks represent higher delta amplitudes in the graphs at the end of each line. Frequency histograms are displayed for each channel.
THETA (3-8 HZ)
The theta rhythm ranges from 3-7 Hz, 4-7 Hz, or 4-8 Hz with 20-100 microvolts (Thompson & Thompson, 2015). Theta may be arrhythmic or rhythmic (Demos, 2019). Theta is seen during drowsiness or starting to sleep, hypnagogic imagery (intense imagery experienced before sleep onset), and hypnosis.The greatest amplitude is found in the frontal and temporal regions of the scalp. Since there may be several theta generators, the theta rhythm is associated with different behavioral processes. The theta rhythm is associated with creativity, but also with anxiety, daydreaming, depression, inattention, and minor TBI. Excessive left hemisphere (LH) theta may be associated with depression, and right hemisphere (RH) theta may be linked to anxiety (Demos, 2019). Graphic © John S. Anderson.
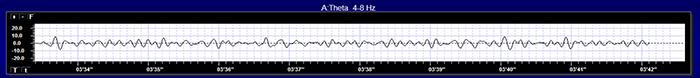
Childhood Disorders
The theta rhythm is the dominant frequency in healthy young children (Thompson & Thompson, 2015). Theta amplitudes and normative theta-to-beta ratios are higher in children than older adults. Children diagnosed with ADHD often have higher ratios than children without ADHD. Theta-to-beta ratios greater than 3:1 may indicate a slow-wave disorder, and children with a slow-wave disorder may have ratios as high as 6:1 (Demos, 2019).Two strategies to reduce high theta-to-beta ratios are amplitude training (down-training theta) and ratio training (rewarding decreases in the theta-to-beta ratio) (Demos, 2019).
Cognitive Decline
Brief memory lapses (senior moments) are associated with LH bursts of rhythmic temporal theta (BORTTs) due to sleepiness or reduced hippocampal perfusion. Assessment and training should incorporate memory tasks. The protocol should inhibit LH temporal lobe theta, particularly at T3. Where BORTTs are produced by drowsiness, training should include behavioral interventions to reduce insomnia (Demos, 2019).While alpha/theta protocols to treat substance use disorders up-train theta, this should be proscribed in epilepsy in the frontal lobes, where it could impair attention or decisions, or in PSTD due to the risk of provoking flashbacks (Demos, 2019).
The movie below is a 19-channel BioTrace+ /NeXus-32 display of theta activity © John S. Anderson. Brighter colors represent higher theta amplitudes. Frequency histograms are displayed for each channel.
ALPHA (8-13 HZ)
The alpha rhythm ranges from 8-12 Hz or 8-13 Hz with 20-60 microvolt synchronous waves. Alpha is the PDR in adults (Rowan & Tolunsky, 2003). Low alpha extends from 8-10 Hz, and high alpha ranges from 11-12 Hz or 11-13 Hz. Low and high refer to frequency and not amplitude.Alpha is defined by its waveform and not by its frequency. For example, a sinusoidal alpha waveform in children may occur at 7 Hz.
Alpha is an idling frequency produced when pools of thalamic neurons fire synchronously as when the eyes are closed. Separate generators produce frontal and occipital alpha. Graphic © John S. Anderson.
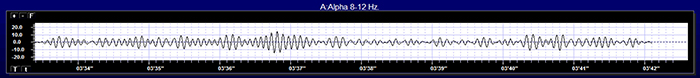
Alpha activity can be observed in about 75% of awake, relaxed individuals. Alpha amplitude is highest in the occipital region and decreases toward the frontal region, where it is the lowest. Alpha spindles, trains of alpha waves visible in the raw EEG, are observed during drowsiness, fatigue, and meditative practice (Demos, 2019; Simon et al., 2011).
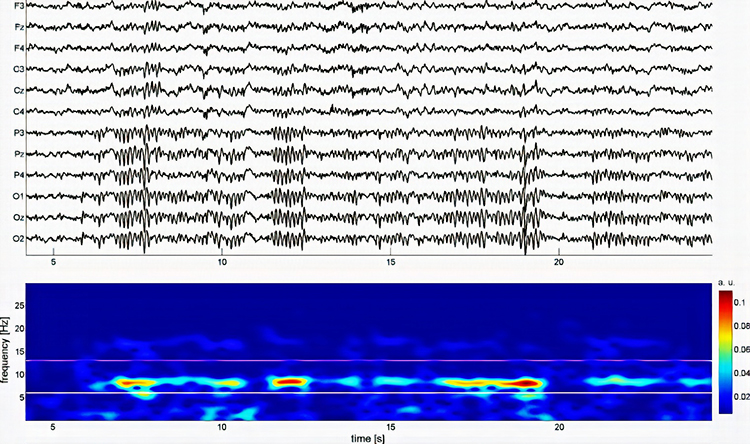
Anxiety and TBI can reduce alpha activity during baselines. Since concentration and thinking can suppress alpha, instruct clients to refrain from these activities during recording (Demos, 2019).
Higher peak alpha frequencies may be healthier because they represent faster processing speeds. Peak frequencies slow with age and specific medication. The alpha rhythm is replaced by low-amplitude desynchronized beta activity during movement, complex problem-solving, and visual focusing. This phenomenon is called alpha blocking (Hugdahl, 1995; Thompson & Thompson, 2015).
Clinicians may be concerned with both high and low alpha amplitudes. Elevated LH alpha may signal depression or learning disabilities. Elevated anterior alpha may accompany ADHD, depression, fogginess, and TBI. Widespread 8-12 Hz alpha in both hemispheres may indicate reduced processing speed. Finally, low-amplitude alpha with high-amplitude beta may signify anxiety or vascular headache (Demos, 2019).
The movie below is a 19-channel BioTrace+ /NeXus-32 display of alpha activity under eyes-closed and eyes-open conditions © John S. Anderson.
SENSORIMOTOR RHYTHM (13-15 HZ)
The sensorimotor rhythm (SMR) ranges from 12-15 or 13-15 Hz and is located over the sensorimotor cortex (central sulcus). The waves are synchronous. The sensorimotor rhythm may signal an internal focus (Demos, 2019). SMR, like alpha, is an idling rhythm. SMR is associated with the inhibition of movement and reduced muscle tone. The SMR is generated by thalamic ventrobasal relay cells and reentrant thalamocortical loops (Thompson & Thompson, 2015). Siang Yin created the graphic below. A = raw waveform; B = power spectrum, C = topographic plot, and D = sites where SMR was detected.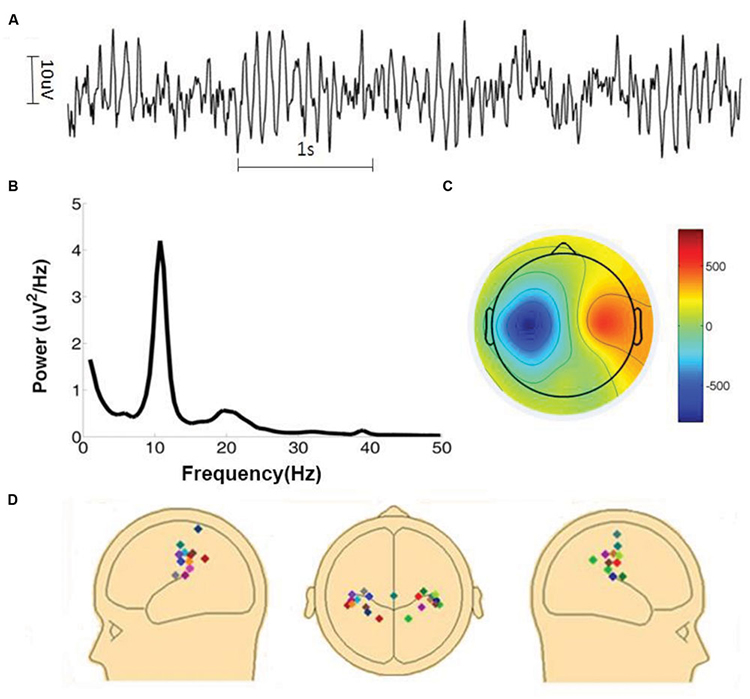
The movie below is a 19-channel BioTrace+ /NeXus-32 display of SMR activity © John S. Anderson. Brighter colors represent higher SMR amplitudes. Frequency histograms are displayed for each channel. Notice the runs of high-amplitude SMR activity.
BETA (over 12 HZ)
The beta rhythm exceeds 12 Hz with 2-20 microvolts asynchronous waves. Asynchronous means the neurons depolarize and hyperpolarize independently. The beta rhythm is distributed across the scalp with the highest amplitude in the frontal and precentral areas. Whereas the sensorimotor cortex generates the sensorimotor rhythm, beta is generated in the brainstem and cortex. Ascending sensory traffic from the brainstem can override thalamic pacemakers (Andreassi, 2000), and specific cortical regions can produce localized beta activity beneath active electrodes (Thompson & Thompson, 2015). Graphic © John S. Anderson.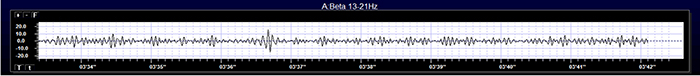
Beta is divided into narrower bands associated with cortical performance and subjective experience. These bands include low beta, high beta, and gamma. Demos (2019) advises that you should specify the actual range of interest.
Low Beta (16-20+ Hz)
The cortex produces low beta when we solve problems like multiplication. When a child correctly answers a math problem, the 17-Hz amplitude may increase while theta and 8-10 Hz alpha amplitude simultaneously decrease. While detected between 12-15 Hz, it is less often seen above 20 Hz (Thompson & Thompson, 2015).High Beta (20-35 Hz)
High beta is correlated with multi-tasking and optimal performance and anxiety, migraine, obsessive-compulsive disorder (OCD), rumination, and worrying. While elevations may indicate a range of disorders, they may represent the brain's compensation for elevated theta. Clinicians rarely reinforce high beta. Instead, they may inhibit high beta and theta (Demos, 2019).Beta Spindles
Beta spindles are trains of spindle-like waveforms with frequencies lower than 20 Hz but more often fall between 22 and 25 Hz. Beta spindles may signal ADHD, especially with tantrums, anxiety, autistic spectrum disorders (ASD), epilepsy, and insomnia (Arns et al., 2015; Demos, 2019; Thompson & Thompson, 2015).
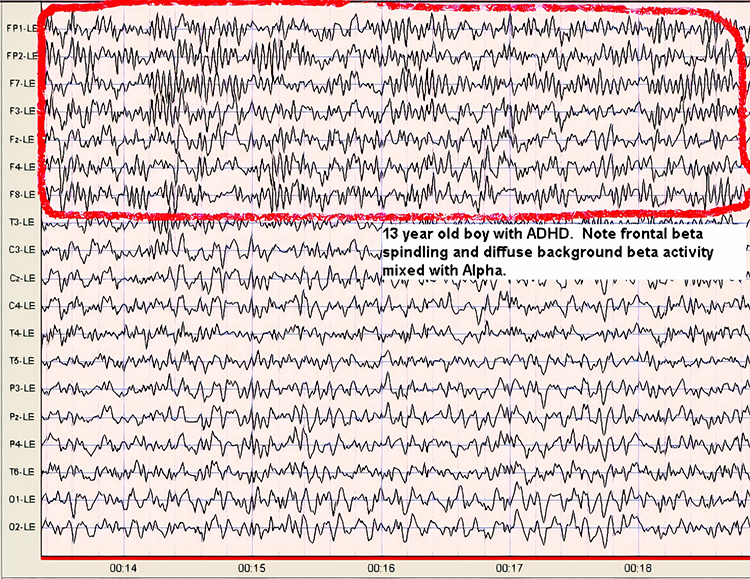
19-21 Hz or 20-23 Hz
Clients diagnosed with anxiety disorder frequently show increased power in the 19-21 Hz or 20-23 Hz range compared with 16-18 Hz. Elevations in these ranges may be associated with emotional intensity. The Thompsons (2015) advise clinicians to use open-ended questions to question clients about their mental activity and emotional state when these bands are elevated without telegraphing their expectations.
24-36 Hz
Clients who are distressed, hypervigilant, and who overthink, worry, and ruminate may show marked elevations in this range. A peak in this range may be associated with family or personal substance use disorder and may indicate the instrumental use of drugs to control anxiety. High-amplitude beta in this range is not always a negative indicator since it is also observed when highly intelligent individuals multi-task (Thompson & Thompson, 2015).
The movie below is a 19-channel BioTrace+ /NeXus-32 display of low beta (13-21 Hz) and high beta (22-34 Hz) activity © John S. Anderson. Brighter colors represent higher beta amplitudes. Frequency histograms are displayed for each channel.
GAMMA (28-80 Hz)
Gamma ranges from 28-80 Hz and includes the Sheer rhythm, which extends from 38-42 Hz. Gamma is not localized but is distributed across the scalp. The overlap between gamma (28-80 Hz) and surface EMG (SEMG) (13-200 Hz) requires that clinicians examine the raw EEG to ensure that training does not reward muscle contraction. Gamma--especially the Sheer rhythm--is associated with learning and problem-solving, meditation, mental acuity, and peak brain function in children and adults. Deficient gamma correlates with deficits in abstract reasoning and memory consolidation (Demos, 2019; Thompson & Thompson, 2015).
There is an increase in 40-Hz activity when individuals perform cognitively demanding tasks. Deficits in this band are associated with learning disorders. This rhythm increases when individuals integrate several attributes into a unified percept (Thompson & Thompson, 2015). For example, 40-Hz activity increases when subjects learn to perceive
meaningful patterns like a Dalmatian concealed by a black and white
background. For this reason, the Sheer rhythm is theorized to be a binding rhythm.
The Sheer rhythm is also associated with peak performance. For example, 40-Hz activity is generated when athletes correct their balance after leaning forward on a balance board. Athletes who have sustained a concussion and suffer impaired balance do not increase 40-Hz power (Demos, 2019; Thompson & Thompson, 2015).
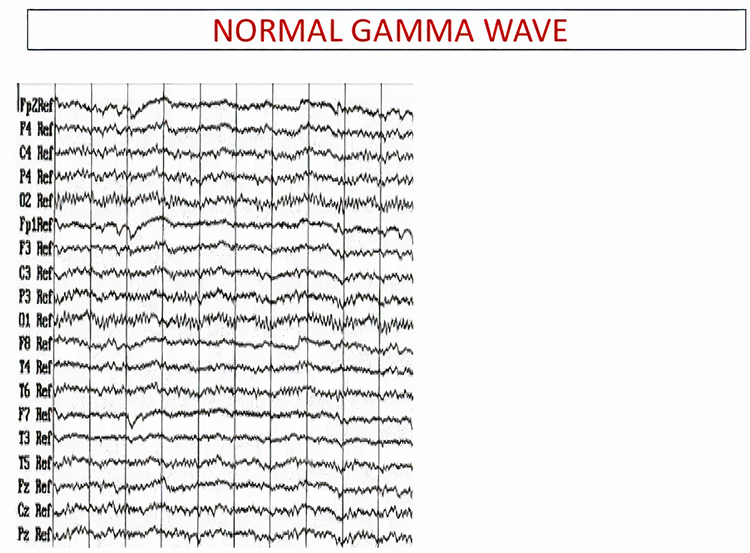
The movie below is a 19-channel BioTrace+ /NeXus-32 display of gamma activity ©
John S. Anderson. . Brighter colors represent higher gamma amplitudes. Frequency histograms are displayed
for each channel. Notice that the mean frequency falls between 38 and 39 Hz.
Waveform Morphology
A wave is a change in the potential difference between two EEG electrodes. Waveform and morphology refer to the shape of the signal generated by oscillating potential differences. Neurofeedback professionals examine the raw waveform's morphology before considering the filtered and quantified EEG (Demos, 2019). EEG activity means a single wave or series of waves (Fisch,1999).
We can distinguish between regular and irregular activity. A regular or monomorphic series of waves are rhythmic with the same frequency and morphology. Rhythmic waves that resemble sine waves are called sinusoidal.
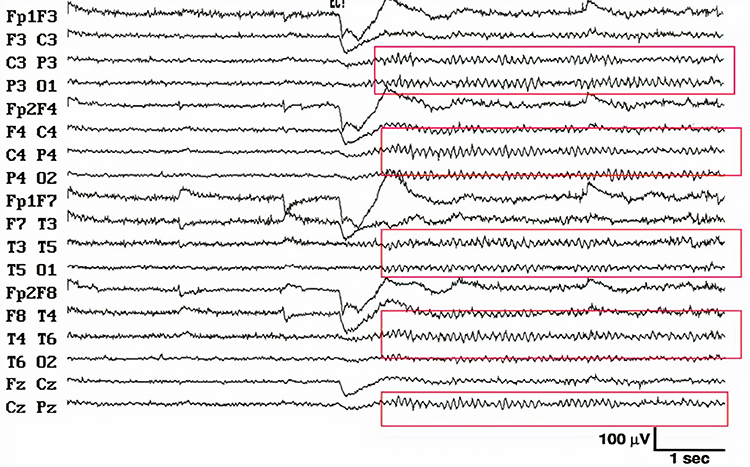
Regular waves may be arch-shaped and resemble wickets. Graphic © eegatlas-online.com.
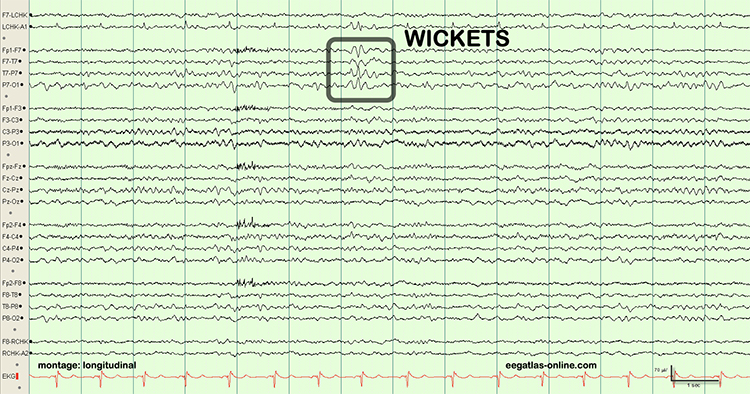
Saw-toothed waves resemble asymmetrical triangles. Graphic © eegatlas-online.com.
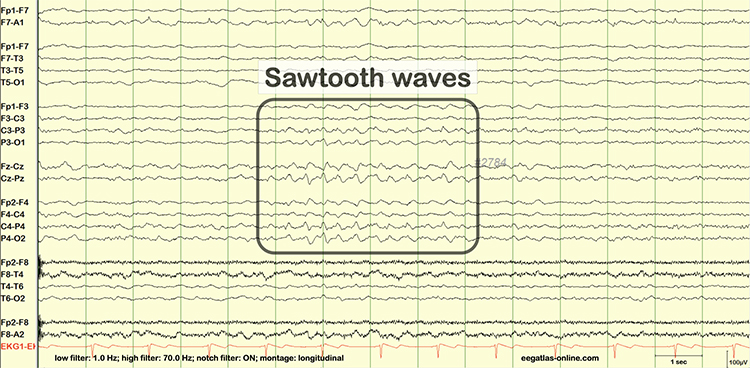
Irregular waves continuously change shape and duration. The graphic below shows runs of irregular high-amplitude delta waves.
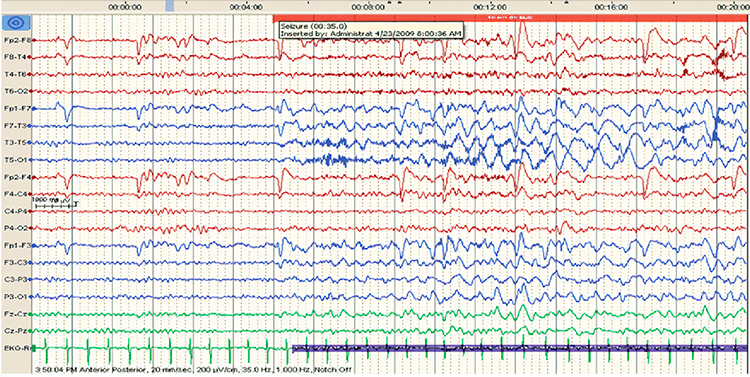
EEG waves may be monophasic or polyphasic. Monophasic waves possess a single upward or downward deflection. Two polyphasic waveforms containing waveforms with two or more elements are diphasic and triphasic waves. Diphasic waves have two elements--one positive and one negative. Triphasic waveforms contain three elements with alternating directions.
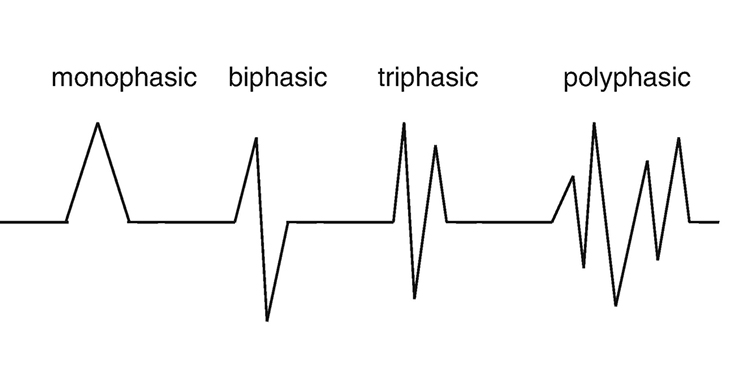
A transient is a single wave or series of waves distinct from background EEG activity.
![]()
Sharp transients are waves with steep peaks that are not produced by epilepsy.
![]()
In contrast, epileptiform activity consists of spikes and sharp waves. An epileptiform spike has a sharp appearance and lasts 20-70 ms. Watch the Blausen Epilepsy and Seizure animations. Graphic © eegatlas-online.com.
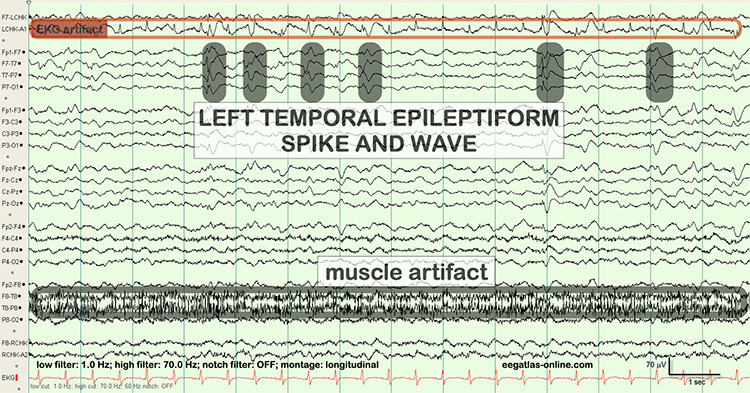
Less steeply shaped sharp waves last 70-200 ms. Complex denotes a series of waves that share a similar shape.
See the K-complex in the EEG record below. Graphic © eegatlas-online.com.
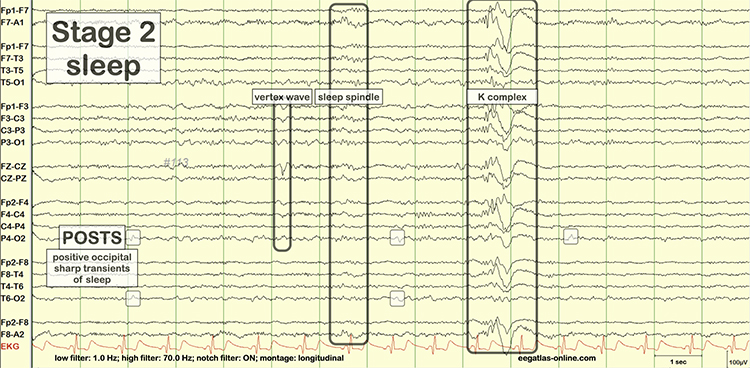
Source Localization
LORETA, sLORETA, and eLORETA
Low resolution electromagnetic tomography (LORETA) is Pascual-Marqui, Michel, and Lehman's (1994) mathematical inverse solution to identify the cortical sources of 19-electrode quantitative data acquired from the scalp. In this context, tomography refers to two-dimensional coronal, horizontal, and sagittal brain slices. LORETA does not identify subcortical sources like the amygdala or thalamus located below the cortical hemispheres (Thompson & Thompson, 2015).LORETA represents cortical sites using three-dimensional voxels, which are volumetric units. While its original voxels had a 7-mm spatial resolution (7 mm x 7 mm x 7 mm), the spatial resolution has increased to 5 mm (5 mm x 5 mm x 5 mm). LORETA values are expressed in amperes per cubic centimeter.
LORETA assigns each voxel x, y, and z Talairach coordinates referencing the original Talairach atlas and subsequent atlases like the Montreal Neurological Institute (MNI) atlas. Talairach coordinate assignment is based on vertical distance from a horizontal line from the anterior commissure (origin) to the posterior commissure. For example, x46, y33, z40 corresponds to Brodmann area 8.
These stereotaxic coordinates are primarily independent of brain shape and volume, which has permitted their use in other imaging methods (e.g., positron emission tomography (PET) and magnetic resonance imaging (MRI). Graphic courtesy of BrainMaster Technologies.
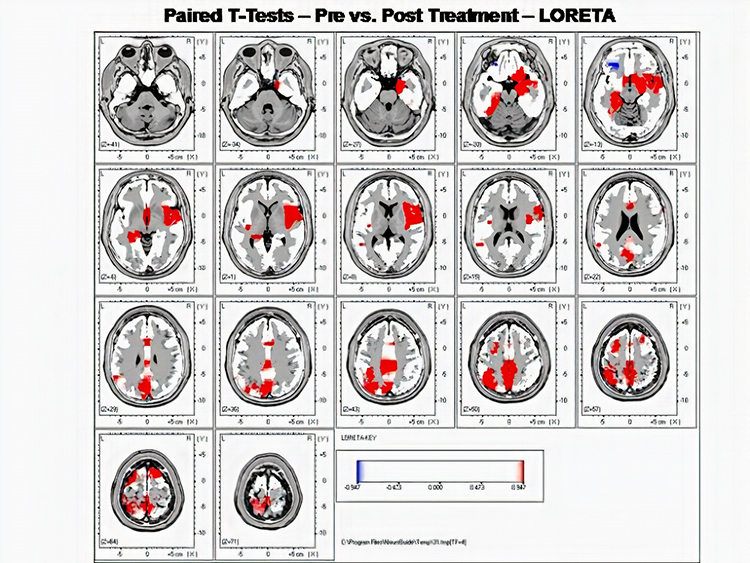
Standardized LORETA (sLORETA) achieves a resolution of 1 cubic centimeter. Smaller voxels more precisely localize cortical EEG sources of surface potentials. sLORETA estimates individual voxel's electrical potentials without regard to their frequency. sLORETA values are expressed in normalized F values. This refinement of LORETA trades absolute units of current density for reduced noise and more precise source localization. This is important because LORETA's "three-sphere model," which assumes different cortex, skull, and skin conductivity, suffers from artifacts ("ghost images") and limited source localization (Thompson & Thompson, 2015). Graphic courtesy of BrainMaster Technologies.
A third version of LORETA, eLORETA, exact low resolution brain electromagnetic tomography, claims no localization error (Thompson & Thompson, 2015). Graphic of theta distribution courtesy of Canuet et al. (2011).
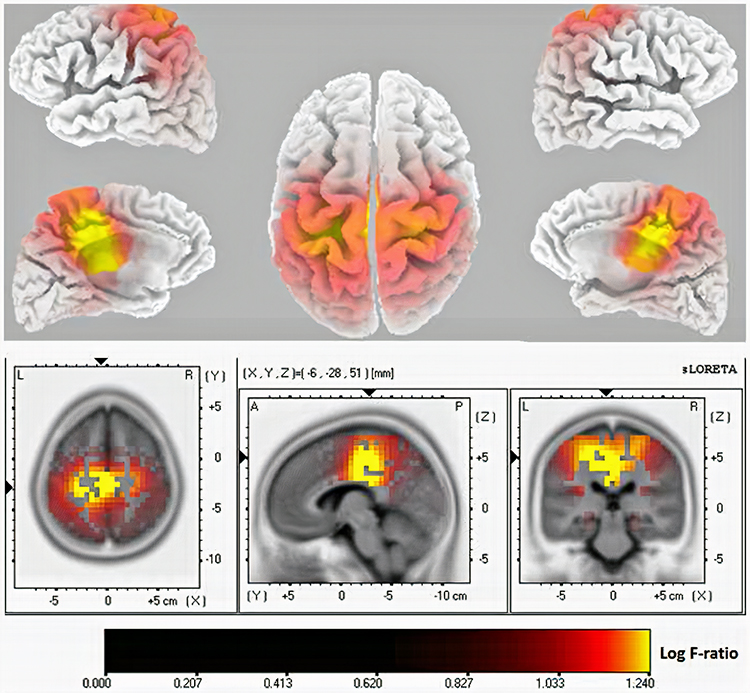
Laplacian Analysis
Surface Laplacian (SL) analysis, which is also called current source density (CSD) and scalp current density (SCD), is a family of mathematical algorithms that provide two-dimensional images of radial current flow from cortical dipoles to the scalp. Positive values represent the current flow from the cortex to the scalp (sources). Negative values represent the current flow from the scalp to the brain (sinks).Unlike the LORETA family of inverse solutions, SL analysis is independent of reference recording procedures--all reference schemes will yield the same current flow estimates and polarity. SL analysis better localizes the EEG signal than surface potentials because it minimizes scalp EEG blurring produced by volume conduction. Finally, unlike inverse solutions, SL makes no assumptions about different tissue conductivity, functional neuroanatomy, cortical geometry and shape, and EEG sources (Kayser & Tenke, 2015).
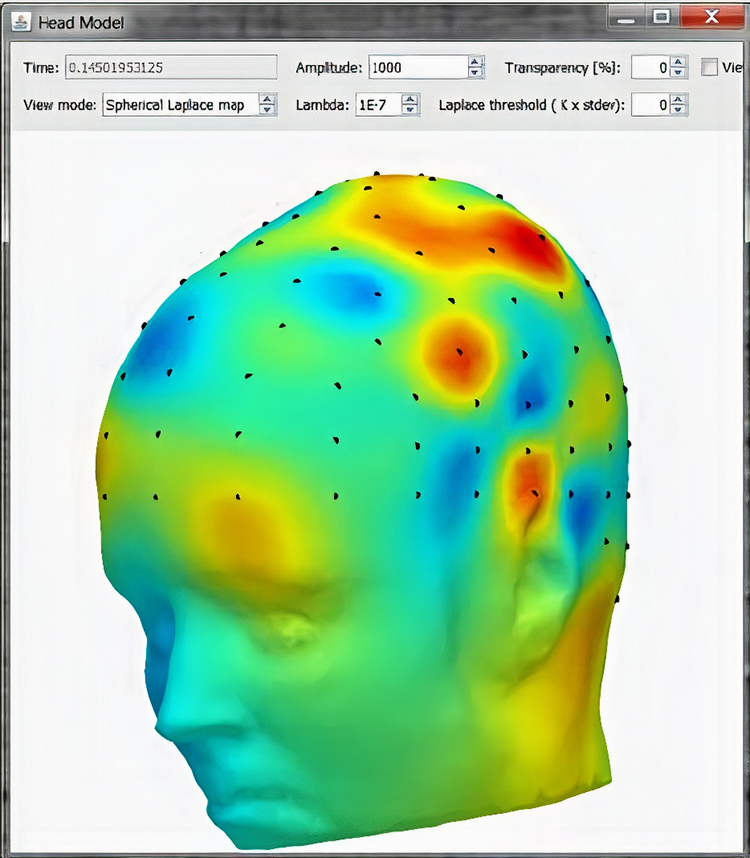
Clinically Significant Raw Waveforms
Clinically significant raw waveforms include kappa rhythm, lambda waves, vertex sharp transients, mu waves, spike and wave, SMR, sleep spindles, and K-complexes.
Kappa Rhythm
The kappa rhythm consists of very low amplitude activity in the alpha or theta range detected over temporal sites during mental activity. Their source (cortical effort or eyelid flutter) is controversial (Fisch, 1999).Lambda Waves
Lambda waves are positive sawtooth-shaped sharp transients detected from occipital sites when individuals view detailed images. Lambda waves last about 200-250 ms and appear as positive occipital sharp transients (POSTs) detected during sleep. These waves won't be observed in clinical EEGs unless the assessment includes viewing complex images. While the presence or absence of lambda waves is not abnormal, striking asymmetry may indicate an abnormality located on the lower amplitude side (Fisch, 1999). Graphic © eegatlas-online.com.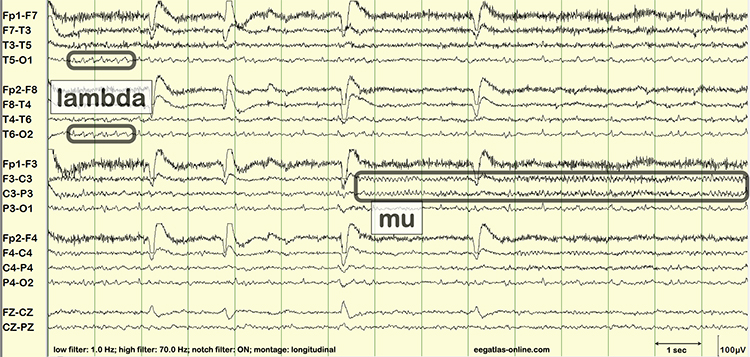
Vertex Sharp Transients
Negative polarity vertex sharp transients (V waves) are detected at the vertex in sleep records but are not usually observed during wakefulness. Rare in adults and more easily elicited in children, V waves may be evoked by unexpected stimuli like clapping. They may be a late evoked potential component independent of sensory modality and not confined to a specific sensory region. Their amplitude is greater during sleep than wakefulness (Fisch, 1999). Graphic © eegatlas-online.com.Mu Waves
The mu rhythm is observed in less than 7% of EEG records, more often in younger adults (Thompson & Thompson, 2015). These 7- to 11-Hz waves resemble wickets and appear as several-second trains over sensorimotor, and less commonly, parietal sites. View the raw EEG at C3 and C4. Mu waves have been associated with mirror neurons and may be observed in children and adults on the autism spectrum. Clinicians inhibit mu activity during training and do not reinforce mu amplitude (Demos, 2019).Clinicians must distinguish the mu rhythm from alpha since they share common frequencies. Alpha waves are sinusoidal instead of wicket-shaped. Mu activity increases when clients reduce motor activity. Mainly contralateral mu activity is suppressed by making a fist, while alpha is not. The alpha rhythm is blocked when clients open their eyes; the mu rhythm is unaffected. The mu rhythm may be evoked by visual scanning tasks (Demos, 2019; Fisch, 1999). Graphic © eegatlas-online.com.
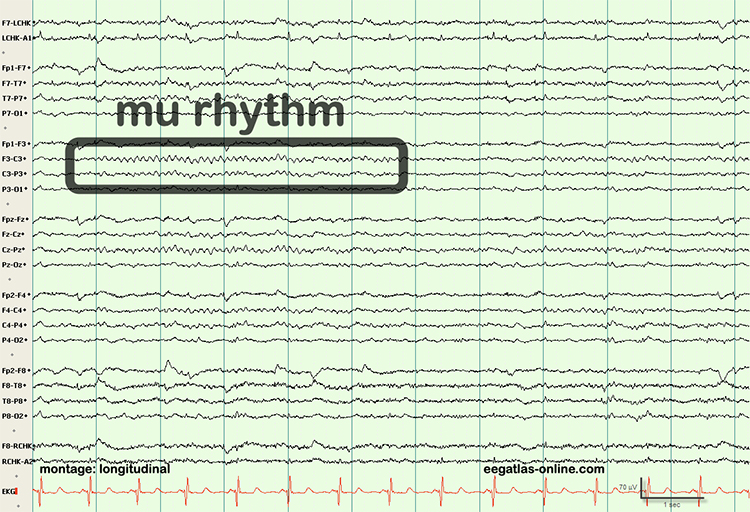
Spike-and-Wave Complexes
Spike-and-wave complexes consist of a spike that is succeeded by a slow wave. In the graphic below,A shows spikes, B represents sharp waves, and C is a spike-and-wave complex. Spike-and-wave complexes have a frequency of 3 Hz with amplitudes over 160 microvolts. They are observed in absence seizures (Thompson & Thompson, 2015).
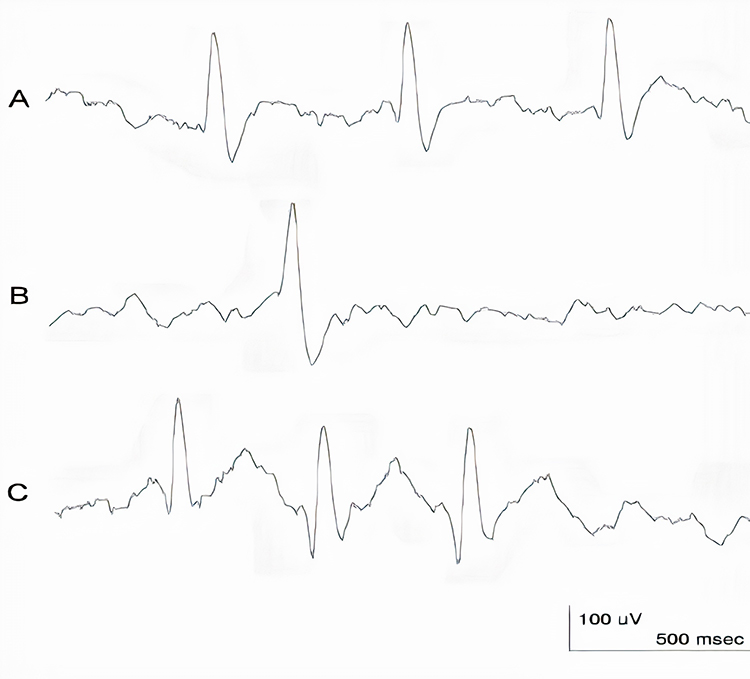
Sensorimotor Rhythm (SMR)
The 13-15 Hz spindle-shaped sensorimotor rhythm (SMR) is detected from the sensorimotor strip when individuals reduce attention to sensory input and reduce motor activity. Where we observe these frequencies at other scalp locations, they appear as desynchronized beta without spindling. The spindle shape is better visualized in microelectrode recordings than scalp EEGs. Since SMR is associated with mental calm and thinking before acting, clinicians may uptrain this rhythm in clients diagnosed with ADHD (Thompson & Thompson, 2015).
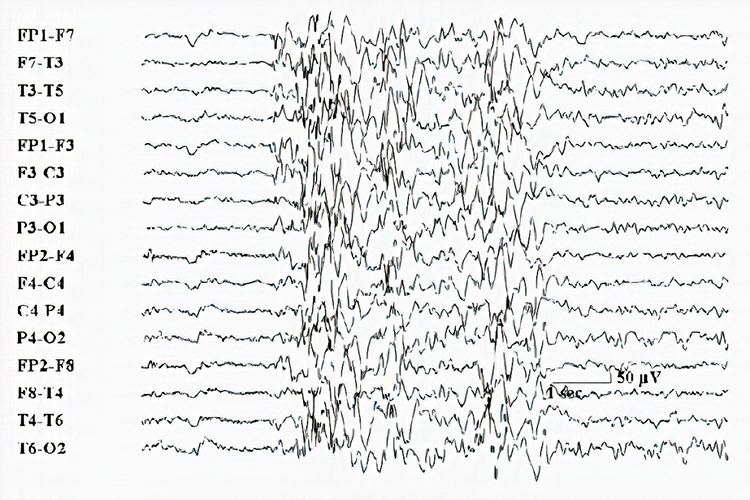
Sleep Spindles
Sleep spindles range from 12-15 Hz and last from 0.5 to several seconds. They resemble SMR spindles, occupy the same frequencies, and are concentrated at central sites. Unlike SMR, which is confined to the sensorimotor strip, sleep spindles are widely distributed over the scalp and are observed during Stage 2 and 3 sleep (Thompson & Thompson, 2015). Graphic © eegatlas-online.com.K-Complexes
K-complexes are also observed in Stage 2 sleep. These sharp negative waveforms reach amplitudes over microvolts, succeeded by a more prolonged moderate-to-high-amplitude positive wave. Graphic © eegatlas-online.com.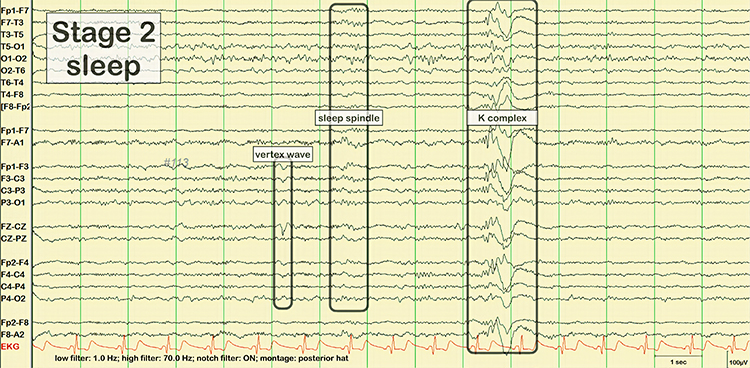
Glossary
alpha blocking: the replacement of the alpha rhythm by low-amplitude desynchronized beta activity during movement, attention, mental effort like complex problem-solving, and visual processing.
alpha rhythm: 8-12-Hz activity that depends on the interaction between rhythmic burst firing by a subset of thalamocortical (TC) neurons linked by gap junctions and rhythmic inhibition by widely distributed reticular nucleus neurons. Researchers have correlated the alpha rhythm with "relaxed wakefulness." Alpha is the dominant rhythm in adults and is located posteriorly. The alpha rhythm may be divided into alpha 1 (8-10 Hz) and alpha 2 (10-12 Hz).
alpha spindles: trains of alpha waves that are visible in the raw EEG and are observed during drowsiness, fatigue, and meditative practice
amplitude: the strength of the EMG signal measured in microvolts or picowatts.
analog: the representation of a signal by a continuously variable physical property like voltage.
analog filter: analog circuits designed using components like capacitors, resistors, and operational amplifiers designed to remove or enhance signal components.
analog-to-digital (A/D) converter: an electronic device that converts continuous signals to discrete digital values.
asynchronous waves: EEG activity where neurons depolarize and hyperpolarize independently.
beta rhythm: 12-38-Hz activity associated with arousal and attention generated by brainstem mesencephalic reticular stimulation that depolarizes neurons in both the thalamus and cortex. The beta rhythm can be divided into multiple ranges: beta 1 (12-15 Hz), beta 2 (15-18 Hz), beta 3 (18-25 Hz), and beta 4 (25-38 Hz).
beta spindles: trains of spindle-like waveforms with frequencies that can be lower than 20 Hz but more often fall between 22 and 25 Hz. They may signal ADHD, especially with tantrums, anxiety, autistic spectrum disorders (ASD), epilepsy, and insomnia.
bit: binary digit; the smallest measurement unit for quantifying information that assumes a value of 0 or 1.
bit number: the number of voltage levels that an A/D converter can discern. A resolution of 16 bits means that the converter can discriminate among 65,536 voltage levels.
complex: a series of waves that share a similar shape.
delta rhythm: 0.05-3 Hz oscillations generated by thalamocortical neurons during stage 3 sleep.
desynchrony: pools of neurons fire independently due to stimulation of specific sensory pathways up to the midbrain and high-frequency stimulation of the reticular formation and nonspecific thalamic projection nuclei.
digital: representation of a signal property like voltage using a series of the digits 0 and 1.
digital filter: a circuit that uses digital processors, like a digital signal processing (DSP) chip, to remove or enhance signal components.
digitization: encoding analog information like continuously changing voltage into a series of the digits 0 and 1.
diphasic waves: waves that possess two elements--one positive and one negative.
dominant frequency: the frequency with the greatest amplitude; at least 13 Hz in awake adults.
dynamic range: the ability to sample a wide range of signal voltages.
EEG activity: a single wave or series of waves.
epileptiform activity: spikes and sharp waves associated with seizure disorders.
epoch: signal sampling period; commonly, a 1-s sample of EEG activity.
exact low resolution brain electromagnetic tomography (eLORETA): a version of LORETA that claims no localization error.
Fast Fourier Transform (FFT): a mathematical transformation that converts a complex signal into component sine waves whose amplitude can be calculated.
FFT filter: a filter that uses Fast Fourier transforms to calculate the average voltage of an EEG signal's component frequencies for a specified period.
filter: an electronic circuit that removes or enhances signal components.
FIR filter: a filter that continuously updates its averaging of EEG voltage with new data points.
frequency: the number of complete cycles that an AC signal completes in a second, usually expressed in hertz.
gamma: 28-80 Hz rhythm that includes the 38-42 Hz Sheer rhythm and is associated with learning and problem-solving, meditation, mental acuity, and peak brain function in children and adults.
hertz (Hz): unit of frequency measured in cycles per second.
high beta: 20-35 Hz rhythm correlated with multi-tasking and optimal performance and anxiety, migraine, obsessive-compulsive disorder (OCD), rumination, and worry.
high-frequency filter (HFF; low-pass filter): a filter that attenuates frequencies above a cutoff frequency.
IIR filter: a recursive filter that uses part of its output as input. IIR filters attenuate frequencies outside the bandpass more sharply than FIR filters with the same order, have greater time delay (that depends on frequency) due to greater filter sharpness, achieve faster computation due to their lower order, and are less stable than FIR filters.
irregular waves: EEG waves that continuously change shape and duration.
Joint time-frequency analysis (JTFA): an algorithm that computes values on each data point at rates up to 256 times per second without using a fixed epoch length. Where FFT simultaneously calculates amplitudes for all frequency bands, JTFA analyzes preselected bands.
K-complex: sharp negative waveforms that reach amplitudes over microvolts succeeded by a longer moderate-to-high-amplitude positive wave observed in Stage 2 sleep.
kappa rhythm: very low amplitude activity in the alpha or theta range detected over temporal sites during mental activity.
low beta: 16-20+ Hz rhythm associated with successful problem-solving.
low resolution electromagnetic tomography (LORETA): Pascual-Marqui's (1994) mathematical inverse solution to identify the cortical sources of 19-electrode quantitative data acquired from the scalp.
low-frequency filter (high-pass filter): a circuit that filters out low-frequency activity and passes only the frequencies above a set value (e.g., 1.6 Hz).
magnitude: the average amplitude over a unit of time using quantification methods like peak-to-peak (P-P) and root mean square (RMS).
microvolt: one-millionth of a volt.
monomorphic waves: series of waves that are rhythmic with the same frequency and morphology.
morphology: the shape of the signal generated by oscillating potential differences.
mu rhythm: 7-11-Hz waves resemble wickets and appear as several-second trains over central or centroparietal sites (C3 and C4).
notch filter: a circuit that suppresses a narrow band of frequencies, such as those produced by line current at 50/60Hz.
order: the maximum delay in samples used in creating each output sample.
peak-to-peak (p-p): a signal quantification method that measures waveform "height" from peak to trough.
percent power: the expression of power within a frequency band as a percentage of total EEG power.
polyphasic waves: waveforms with two or more elements; diphasic and triphasic waves.
posterior dominant rhythm (PDR): the highest-amplitude frequency detected at the posterior scalp when eyes are closed.
power: amplitude squared and may be expressed as microvolts squared or picowatts/resistance.
Quantitative EEG (qEEG): digitized statistical brain mapping using at least a 19-channel montage to measure EEG amplitude within specific frequency bins.
raw EEG signal: oscillating electrical potential differences detected from the scalp.
reference electrode: an electrode that is placed on the scalp, earlobe, or mastoid.
regular waves: rhythmic waves with the same frequency and morphology.
root mean square (RMS): a signal quantification method that calculates the area under the EEG waveform and is analogous to the weight of an object.
sampling rate: the number of times per second that an ADC samples the EEG signal.
sampling resolution: the number of digital bits used to represent a signal.
saw-toothed waves: waves that resemble asymmetrical triangles.
sensorimotor rhythm (SMR): 13-15 Hz spindle-shaped sensorimotor rhythm (SMR) detected from the sensorimotor strip when individuals reduce attention to sensory input and reduce motor activity.
sharp transients: waves with steep peaks that are not produced by epilepsy.
sharp waves: steeply-shaped waves with 70-200 ms duration.
Sheer rhythm: a 38-42 Hz rhythm associated with learning and problem-solving, meditation, mental acuity, and peak brain function in children and adults.
sinusoidal: rhythmic waves that resemble sine waves.
sleep spindle: waves that range from 12-15 Hz and last from 0.5 to several seconds widely distributed over the scalp and are observed during Stage 2 and 3 sleep.
spike: a waveform with a sharp appearance that lasts 20-70 ms.
spike-and-wave complexes: spikes that are succeeded by slow waves.
standardized LORETA (sLORETA): a refinement of LORETA that estimates each voxel's electrical potentials without regard to their frequency, expresses normalized F-values, and achieves a 1-cubic-cm resolution.
surface Laplacian (SL) analysis: a family of mathematical algorithms that provide two-dimensional images of radial current flow from cortical dipoles to the scalp.
synchrony: the coordinated firing of pools of neurons due to pacemakers and mutual coordination.
Talairach coordinate: coordinate assignment based on vertical distance from a horizontal line from the anterior commissure (origin) to the posterior commissure; referenced to the Talairach or Montreal atlases.
theta rhythm: 4-8-Hz rhythms generated a cholinergic septohippocampal system that receives input from the ascending reticular formation and a noncholinergic system that originates in the entorhinal cortex, which corresponds to Brodmann areas 28 and 34 at the caudal region of the temporal lobe.
transient: a single wave or series of waves distinct from background EEG activity.
triphasic wave: a wave that consists of three elements with alternating directions.
vertex (Cz): the intersection of imaginary lines drawn from the nasion to inion and between the two preauricular points in the International 10-10 and 10-20 systems.
vertex sharp transient (V wave): a negative-polarity waveform detected at the vertex in sleep records but are not usually observed during wakefulness.
voxel: a volumetric unit.
wave: a plot of voltage using a bipolar (positive/negative) scale with zero in the middle; the analog form of the signal in which voltage continuously varies.
waveform: the shape of the signal that is generated by oscillating potential differences between two electrodes.
REVIEW FLASHCARDS ON QUIZLET
Click on the Quizlet logo to review our chapter flashcards.
Assignment
Now that you have completed this module, write down the frequency bands you uptrain and downtrain in clinical or peak performance practice and explain the rationale for these choices.
References
Collura, T. F. (2014). Technical foundations of neurofeedback. Taylor & Francis.
Demos, J. N. (2019). Getting started with neurofeedback (2nd ed.). W. W. Norton & Company.
Fisch, B. J. (1999). Fisch and Spehlmann's EEG primer (3rd ed.). Elsevier.
Hugdahl, K. (1995). Psychophysiology: The mind-body perspective. Harvard University Press.
Kayser, J., & Tenke, C. E. (2015). On the benefits of using surface Laplacian (current source density) methodology in electrophysiology. Int J Psychophysiol, 97(3), 171-173. https://dx.doi.org/10.1016%2Fj.ijpsycho.2015.06.001
Libenson, M. H. (2010). Practical approach to electroencephalography. Saunders Elsevier.
Lubar, J. F. (2001). Rationale for choosing bipolar versus referential training. Journal of Neurotherapy, 4(3), 94–97.
Nunez, P. L., & Srinivasan, R. (2006). Electric fields of the brain (2nd ed.). Oxford University Press.
Rowan, A. J., & Tolunsky, E. (2003). Primer of EEG with a mini-atlas. Butterworth-Heinemann.
Simon, M., Schmidt, E. A., Kincses, W. E., Fritzsche, M., Bruns, A., Aufmuth, C., Bogdan, M., Rosenstiel, W., & Schrauf, M. (2011). EEG alpha spindle measures as indicators of driver fatigue under real traffic conditions. Clinical Neurophysiology, 122(6), 1168–1178. https://doi.org/10.1016/j.clinph.2010.10.044
Thompson, M., & Thompson, L. (2015). The biofeedback book: An introduction to basic concepts in applied psychophysiology (2nd ed.). Association for Applied Psychophysiology and Biofeedback.
D. ASEPTIC TECHNIQUES
A neurofeedback provider applied reusable EEG sensors to the scalp of a high school wrestler with skin lesions. When questioned, the wrestler explained that the lesions were due to mat abrasion and that all the wrestlers on his team had them. Since the clinician did not disinfect the sensors in between sessions, several of her clients developed MRSA infections and sued him for malpractice. This vignette was adapted from Moss (2013).

Neurofeedback providers may underestimate their risk of transmitting infection to their clients and may lack basic knowledge about risk mitigation strategies. Although clinicians may assume that infection risk is low since neurofeedback is noninvasive, handshakes, reclining chairs, cables, and sensors can easily transfer infectious organisms to clients. Moreover, over-abrasion in neurofeedback can expose sensors to client blood (Spaulding semi-critical classification), and inserted pelvic and rectal sensors expose sensors to tissue (Spaulding critical classification). This ubiquitous problem is called common vehicle transmission.
Aseptic means free from disease-causing microorganisms. Aseptic techniques prevent contamination by harmful bacteria, viruses, or other microorganisms. Infection risk mitigation involves three strategies: handwashing and drying, disinfection of surfaces clients will contact, and disinfection or sterilization of sensors and cables (Hagedorn, 2014).
This unit covers Client and Trainer Hygiene, Screening, Hand Cleaning, Masks, Social Distance, Equipment Sterilization, Cross-Contamination, and Best Practices.
CLIENT AND TRAINER HYGIENE
Moss and colleagues (2019) encourage clinicians to adopt a forensic perspective:
Think like a crime scene investigative agent. When you're working with a client, it is easy to touch the client, equipment, and workspace surfaces without awareness. If the client has a skin condition or even a cold, any object the practitioner touches in the environment can become a health hazard for the practitioner and for other clients. Restrict touching to a minimum and keep the things you touch in the same area, so they can be cleaned between clients. (pp. 338-339).
Screening
All staff should monitor their temperature and fever, respiratory symptoms, and other symptoms before leaving for work. Staff should administer the same symptom checklist before clients leave for the clinic. When clients arrive, take their forehead temperature using a contact-less infrared thermometer. Graphic © Dimitry Naumov/Shutterstock.com.

Hand Cleaning
Upon arrival, staff should disinfect their hands with soap and water or a sanitizing product containing at least 60% isopropyl alcohol. CDC (2020) guidelines for handwashing include five steps:
- Wet your hands with clean, running water (warm or cold), turn off the tap, and apply soap.
- Lather your hands by rubbing them together with the soap. Lather the backs of your hands, between your fingers, and under your nails.
- Scrub your hands for at least 20 seconds. Need a timer? Hum the “Happy Birthday” song from beginning to end twice.
- Rinse your hands well under clean, running water.
- Dry your hands using a clean towel or air dry them.
Graphic © Black Duck Style/Shutterstock.com.

They should don disposable gloves and change them after training each client. Graphic © PENpicks Studio/Shutterstock.com.

Clients should disinfect their hands upon arrival with a sanitizing product. Both clients and staff should repeat this hand-cleaning process before leaving the clinic. Graphic © TRADOL/Shutterstock.com.

Masks
Staff should wear masks and face shields to protect themselves and their clients. They should provide disposable masks to clients who need them and require their use while in the clinic. Graphic © theskaman306/Shutterstock.com.

Social Distance
Remote neurofeedback training is the safest approach since clients remain at home. Clinicians should consider models that ensure the same quality of training as provided within a clinic. Graphic © Symphonic Mind Ltd.
If there are two doors, designate one as an entrance and another as an exit. Arrange the waiting area to exceed the minimum CDC recommended 6-ft (1.83-m) spacing between chairs. A plexiglass partition between reception staff and clients is desirable. Graphic © anon_tae/Shutterstock.com.

After skin preparation and cap or individual sensor placement, staff should interact with clients from the recommended distance or remotely from a control room.
EQUIPMENT STERILIZATION
Sterilization destroys all microbial life using chemical or physical methods. Disinfection by chemical agents or wet pasteurization removes many microorganisms except for bacterial spores on inanimate objects (CDC, 2020). With the exception of sensors that risk skin puncture and contact with blood, clinics will mainly mitigate infection using disinfectants.
Staff should wipe all surfaces that they or clients could touch with disinfectants like Freshnit®, Protex Disinfectant Spray®, or Virusolve®. These products are sporicidal and can destroy Clostridium difficile and methicillin-resistant Staphylococcus aureus. Products containing 20% isopropyl alcohol are ineffective against these pathogens (Hagedorn, 2019). Graphic courtesy of Bio-Medical Instruments.

Staff should use powerful disinfectants on sensors and leads applied to clients. Apply the product with a cloth and then remove excess with a wet cloth after a few minutes. Rinse the sensors, leads, and straps with lukewarm water, and air dry to minimize skin irritation. Never immerse sensors and leads in a cleaning product since this can damage them (Moss et al., 2019).
Despite the cost of disposable electrodes, they reduce the risk of infection transmission. Clinicians should dispose of them after each use because they may mistakenly apply them to a different client. Furthermore, their surfaces quickly degrade, compromising signal quality (Moss et al., 2019).
CROSS-CONTAMINATION
Cross-contamination is the inadvertent transfer of microorganisms from one individual or site to another. Infection mitigation should be guided by the Spaulding classification system for medical devices and sterilization (Rutala, Weber, & Healthcare Infection Control Practices Advisory Committee, 2008).
The Spaulding classification system identifies three levels of risk: critical, semi-critical, and noncritical. Neurofeedback caps and electrodes fall into the semi-critical and noncritical categories (Moss et al., 2019).
Critical means that sensors may breach the vascular space by puncturing the skin. Electrode prongs that can penetrate skin layers belong in this category and require sterilization. Vaporized hydrogen peroxide is a lower-temperature sterilization method that won't damage sensors like an autoclave or heat from 325-375 °F (Moss et al., 2019).
Semi-critical means that sensors can contact mucous membranes and blood due to skin abrasion. Reusable EEG cap sensors and individual sensors fall into this category and require high-level disinfection, destroying most microorganisms. Avoid abrasive cleaning products. Instead, use disinfectants like "Cidex®, Protex®, and Sekusept® PLUS" (Moss, 2019, p. 340).
Noncritical means that the sensors can only contact non-mucous membranes and intact skin. Disposable EEG sensors and sensor hubs belong in this category and require intermediate or low-level disinfection. While high-level disinfectants may be used, bleach, high-concentration isopropyl alcohol, and improved hydrogen peroxide are effective cleaning agents (Moss et al., 2019).
The table below was slightly modified from Moss et al. (2019).
Best Practices
Skin Preparation
Current EEG amplifiers reduce the need for skin abrasion, increasing the risk of disease transmission by blood cells--even when blood is not visible. Ferree et al. (2001) discourage the use of blunt needles. If used, clinicians should discard them in a biohazard sharps container. After cleaning the skin with an alcohol pad, it can transmit infection and must be safely discarded without contacting common surfaces.Do not apply abrasive gels like NuPrep with your gloved finger--use a cue tip instead. Discard each contaminated cue tip and use a new one to not contaminate the tube. Measuring tapes used to calculate head circumference present a noncritical risk and require low-level disinfection.
When transferring conductive gel into a disposable plastic syringe, do not reinsert the blunt-tip needle into the gel container once it has touched you or the client.
Treat used blunt-tip needles, cue tips, tissues, and alcohol-impregnated wipes as biohazards and immediately safely discard them after use. Do not place them on a desk or tabletop where they can transmit disease (Moss, 2019).
Sensors
When clinicians place EEG sensors on abraded skin, this presents a semi-critical risk and requires high-level disinfectants like Cidex®, Protex™, and Sekusept® PLUS. When reusing EEG sensors, it is ideal only to reuse them with the same client.Glossary
common vehicle transmission: a mode of transmission of infectious pathogens from a source that is common to all the cases of a specific disease.
critical: a Spaulding infection risk category for sensors that may breach the vascular space by puncturing the skin.
cross-contamination: the inadvertent transfer of microorganisms from one individual or site to another.
disinfection: a process involving chemical agents or wet pasteurization that removes many microorganisms except for bacterial spores on inanimate objects.
noncritical: a Spaulding infection risk category for sensors that can only contact non-mucous membranes and intact skin.
semi-critical: a Spaulding infection risk category for sensors that can contact mucous membranes and blood due to skin abrasion.
Spaulding classification system: a scheme that places reusable medical instruments or devices into three categories of ascending infection risk.
sterilization: a process that destroys all microbial life using chemical or physical methods.
REVIEW FLASHCARDS ON QUIZLET
Click on the Quiz let logo to review our chapter flashcards.
Assignment
Now that you have completed this module, identify ways to improve infection mitigation in your clinical practice.
References
Centers for Disease Control and Prevention (2020). Introduction, methods, definition of terms: Guideline for disinfection and sterilization in healthcare facilities (2008). Retrieved from https://www.cdc.gov/infectioncontrol/guidelines/disinfection/introduction.html.
Ferree, T. C., Luu, P., Russell, G. S., & Tucker, D. M. (2001). Scalp electrode impedance, infection risk, and EEG data quality. Clinical Neurophysiology, 112(3), 536–544. https://doi.org/10.1016/s1388-2457(00)00533-2
Hagedorn, D. (2019). Infection risk mitigation for biofeedback providers. In D. Moss & F. Shaffer (Eds.), Physiological recording technology and applications in biofeedback and neurofeedback (pp. 334-336). Association for Applied Psychophysiology and Biofeedback.
Moss, D., Hagedorn, D., Combatalade, D., & Neblett, R. (2019). Care for biofeedback and neurofeedback instrumentation. In D. Moss & F. Shaffer (Eds.), Physiological recording technology and applications in biofeedback and neurofeedback (pp. 334-336). Association for Applied Psychophysiology and Biofeedback (pp. 337-347).
Rutala, W. A., Weber, D. J., & Healthcare Infection Control Practices Advisory Committee (2008). Guideline for disinfection and sterilization in healthcare facilities, 2008. Retrieved from www.cdc.gov/infectioncontrol/pdf/guidelines/disinfection-guidelines.pdf
E. INSTRUMENTATION DEMONSTRATION
This unit covers Brief Training Demonstration, NewQ Assessment with Live Demonstrations, and International 10-20 System Demonstration.
BRIEF TRAINING DEMONSTRATION
This movie is a 19-channel BioTrace+ /NeXus-32 display of EEG recording © John S. Anderson.
The next video shows the client (played by Travis, the clinician’s husband) in a typical chair used for training. The clinician, Cortney Amundson of Mindful Restoration in Edina, Minnesota, provided Travis with visual and auditory feedback that responds to his training goals, which have been previously identified using a brief, six-location assessment tool known as the NewQ. A training protocol was identified as appropriate for his concerns from this assessment.
The specific training protocol is to increase 12-15 Hz EEG activity, known as the sensorimotor rhythm or SMR, at the Cz electrode in the central vertex area over the sensorimotor cortex. At the same time, two additional training signals are selected for what is known as inhibit training, which involves setting a threshold or goal to train Travis to limit the activity in these signals, in this case, 4-8 Hz theta and 22-36 Hz high or fast beta.
This combination training approach is a standard, evidence-based training intervention. The clinician instructs Travis to observe the training screen, which responds to his EEG activity by presenting a video in normal mode when all goals are being met and which changes to a screening or masking mode in a gradual response to undesirable EEG changes.
Travis observes the screen to watch the video, as much as possible, in the unaltered normal mode, minimizing the masking changes by regulating his EEG activity. As he progresses, the clinician changes the threshold manually, first informing him of this change to understand the resulting change in the feedback display. He is encouraged to modify his EEG a bit more to return to an unimpeded visual and auditory reward. Threshold changes are only made when the client’s progress warrants such changes. There are no automatic threshold adjustments as these violate the training nature of the procedure, which requires the client to reach the defined goal to receive the full reward. An automatic change to the thresholds would remove the need for the client to demonstrate skill acquisition to receive the reward. The client would receive a set percentage reward at all times, despite his participation or lack thereof.
Travis is engaged in skill acquisition even though the clinician instructs him to do nothing but observe the screen. Before the beginning of the session, the requirements for success were described in detail to know what changes would result in positive feedback. However, the effortful attempt to “make” the feedback occur generally impedes the learning process. Therefore, his participation is essentially to know what needs to change, maintain his attention and interest in the feedback, and be motivated to receive the full feedback reward.
The areas of the central nervous system responsible for making the changes are not under conscious volitional control. The training process has been described as one of passive volition. Simply attending to the feedback and remaining alert and interested in the process typically results in skill acquisition. The client needs to attend to how they feel and notice internal changes that correspond to full reward feedback. This will allow them to alter their EEG activity in a non-cognitive volitional manner, resulting in a more consistent state corresponding to the set goals. Once the responses become more dependable, the threshold goals may be changed to encourage even greater change in the desirable direction, as demonstrated in the video © J. S. Anderson.
NewQ Assessment with Live Demonstrations
This is a demonstration of the clinical assessment known as the NewQ. Like other clinical assessments such as the ClinicalQ from Paul Swingle, PhD and New Mind Maps from Richard Soutar, PhD, the NewQ utilizes an understanding of the EEG behaviors associated with certain tasks and makes interpretations based upon EEG information from standard literature sources and the clinical experience of the developer of the assessment.
This video begins with a discussion of the NewQ as it is administered, how to identify and minimize artifact and the types of tasks to be performed by the client. This is followed by an abbreviated administration of the assessment, using a non-client volunteer and then a view of the screens and the process of collecting the data using a saved session. This is followed by a demonstration of the data analysis and finishes with a discussion of the sample results.
This is just one example of these types of assessment tools. Neurofeedback Tutor also contains videos of 19-channel recordings and the use of a normative database.
Finally, Neurofeedback Tutor also contains discussions of some of the standard training protocols that can be used once the clinical assessment has been performed. Video © J. S. Anderson.